Eastern European vs Ottawa Disability Age Under 5
COMPARE
Eastern European
Ottawa
Disability Age Under 5
Disability Age Under 5 Comparison
Eastern Europeans
Ottawa
1.4%
DISABILITY AGE UNDER 5
1.0/ 100
METRIC RATING
248th/ 347
METRIC RANK
1.7%
DISABILITY AGE UNDER 5
0.0/ 100
METRIC RATING
321st/ 347
METRIC RANK
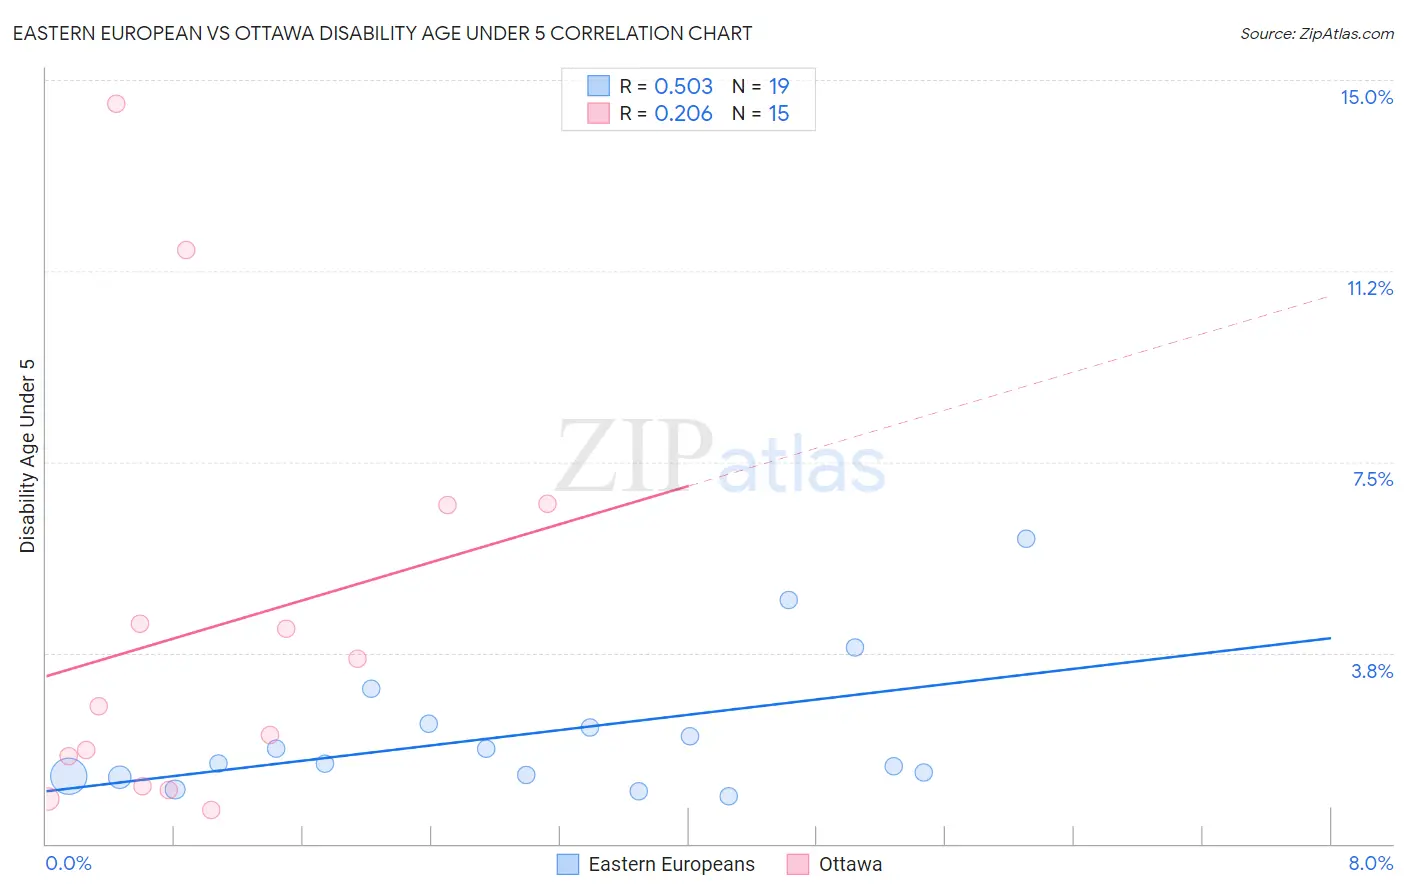
Eastern European vs Ottawa Disability Age Under 5 Correlation Chart
The statistical analysis conducted on geographies consisting of 231,188,302 people shows a substantial positive correlation between the proportion of Eastern Europeans and percentage of population with a disability under the age of 5 in the United States with a correlation coefficient (R) of 0.503 and weighted average of 1.4%. Similarly, the statistical analysis conducted on geographies consisting of 39,604,340 people shows a weak positive correlation between the proportion of Ottawa and percentage of population with a disability under the age of 5 in the United States with a correlation coefficient (R) of 0.206 and weighted average of 1.7%, a difference of 25.0%.
Disability Age Under 5 Correlation Summary
| Measurement | Eastern European | Ottawa |
| Minimum | 0.93% | 0.66% |
| Maximum | 6.0% | 14.5% |
| Range | 5.1% | 13.9% |
| Mean | 2.2% | 4.3% |
| Median | 1.6% | 2.7% |
| Interquartile 25% (IQ1) | 1.3% | 1.1% |
| Interquartile 75% (IQ3) | 2.4% | 6.6% |
| Interquartile Range (IQR) | 1.0% | 5.5% |
| Standard Deviation (Sample) | 1.4% | 4.1% |
| Standard Deviation (Population) | 1.3% | 4.0% |
Similar Demographics by Disability Age Under 5
Demographics Similar to Eastern Europeans by Disability Age Under 5
In terms of disability age under 5, the demographic groups most similar to Eastern Europeans are Immigrants from England (1.4%, a difference of 0.030%), Russian (1.4%, a difference of 0.050%), Bermudan (1.4%, a difference of 0.080%), African (1.4%, a difference of 0.090%), and Immigrants from Hungary (1.4%, a difference of 0.12%).
| Demographics | Rating | Rank | Disability Age Under 5 |
| Maltese | 2.2 /100 | #241 | Tragic 1.3% |
| Lumbee | 2.1 /100 | #242 | Tragic 1.3% |
| Immigrants | Cameroon | 1.7 /100 | #243 | Tragic 1.4% |
| Spaniards | 1.4 /100 | #244 | Tragic 1.4% |
| Potawatomi | 1.1 /100 | #245 | Tragic 1.4% |
| Russians | 1.0 /100 | #246 | Tragic 1.4% |
| Immigrants | England | 1.0 /100 | #247 | Tragic 1.4% |
| Eastern Europeans | 1.0 /100 | #248 | Tragic 1.4% |
| Bermudans | 1.0 /100 | #249 | Tragic 1.4% |
| Africans | 1.0 /100 | #250 | Tragic 1.4% |
| Immigrants | Hungary | 1.0 /100 | #251 | Tragic 1.4% |
| Immigrants | Scotland | 0.9 /100 | #252 | Tragic 1.4% |
| Australians | 0.7 /100 | #253 | Tragic 1.4% |
| Immigrants | Brazil | 0.7 /100 | #254 | Tragic 1.4% |
| Immigrants | Liberia | 0.6 /100 | #255 | Tragic 1.4% |
Demographics Similar to Ottawa by Disability Age Under 5
In terms of disability age under 5, the demographic groups most similar to Ottawa are Scotch-Irish (1.7%, a difference of 0.060%), German (1.7%, a difference of 0.57%), Slovak (1.7%, a difference of 0.59%), Irish (1.7%, a difference of 0.89%), and French (1.7%, a difference of 1.2%).
| Demographics | Rating | Rank | Disability Age Under 5 |
| Norwegians | 0.0 /100 | #314 | Tragic 1.7% |
| Dutch | 0.0 /100 | #315 | Tragic 1.7% |
| Immigrants | Cabo Verde | 0.0 /100 | #316 | Tragic 1.7% |
| French | 0.0 /100 | #317 | Tragic 1.7% |
| Irish | 0.0 /100 | #318 | Tragic 1.7% |
| Slovaks | 0.0 /100 | #319 | Tragic 1.7% |
| Scotch-Irish | 0.0 /100 | #320 | Tragic 1.7% |
| Ottawa | 0.0 /100 | #321 | Tragic 1.7% |
| Germans | 0.0 /100 | #322 | Tragic 1.7% |
| Chickasaw | 0.0 /100 | #323 | Tragic 1.7% |
| Cherokee | 0.0 /100 | #324 | Tragic 1.8% |
| Immigrants | Portugal | 0.0 /100 | #325 | Tragic 1.8% |
| Sioux | 0.0 /100 | #326 | Tragic 1.8% |
| Osage | 0.0 /100 | #327 | Tragic 1.8% |
| Americans | 0.0 /100 | #328 | Tragic 1.9% |