Cheyenne vs Immigrants from Norway Disability Age Under 5
COMPARE
Cheyenne
Immigrants from Norway
Disability Age Under 5
Disability Age Under 5 Comparison
Cheyenne
Immigrants from Norway
1.5%
DISABILITY AGE UNDER 5
0.0/ 100
METRIC RATING
282nd/ 347
METRIC RANK
1.3%
DISABILITY AGE UNDER 5
31.1/ 100
METRIC RATING
198th/ 347
METRIC RANK
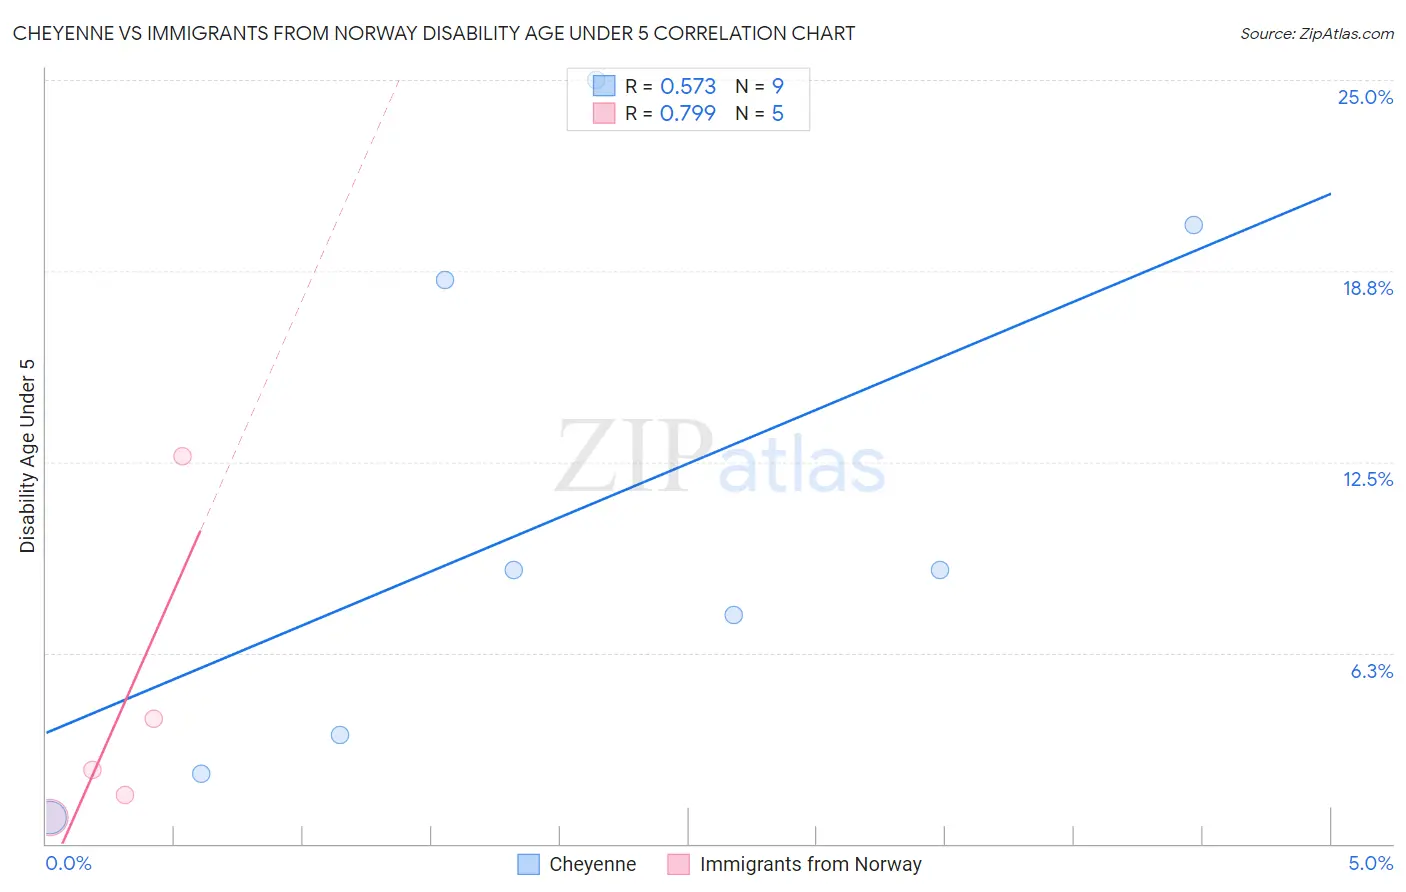
Cheyenne vs Immigrants from Norway Disability Age Under 5 Correlation Chart
The statistical analysis conducted on geographies consisting of 66,176,849 people shows a substantial positive correlation between the proportion of Cheyenne and percentage of population with a disability under the age of 5 in the United States with a correlation coefficient (R) of 0.573 and weighted average of 1.5%. Similarly, the statistical analysis conducted on geographies consisting of 84,343,493 people shows a strong positive correlation between the proportion of Immigrants from Norway and percentage of population with a disability under the age of 5 in the United States with a correlation coefficient (R) of 0.799 and weighted average of 1.3%, a difference of 20.2%.
Disability Age Under 5 Correlation Summary
| Measurement | Cheyenne | Immigrants from Norway |
| Minimum | 0.85% | 0.87% |
| Maximum | 25.0% | 12.7% |
| Range | 24.1% | 11.8% |
| Mean | 10.6% | 4.3% |
| Median | 9.0% | 2.4% |
| Interquartile 25% (IQ1) | 2.9% | 1.2% |
| Interquartile 75% (IQ3) | 19.4% | 8.4% |
| Interquartile Range (IQR) | 16.4% | 7.2% |
| Standard Deviation (Sample) | 8.6% | 4.8% |
| Standard Deviation (Population) | 8.1% | 4.3% |
Similar Demographics by Disability Age Under 5
Demographics Similar to Cheyenne by Disability Age Under 5
In terms of disability age under 5, the demographic groups most similar to Cheyenne are Delaware (1.5%, a difference of 0.19%), European (1.5%, a difference of 0.25%), Czechoslovakian (1.5%, a difference of 0.34%), Croatian (1.5%, a difference of 1.4%), and Tlingit-Haida (1.5%, a difference of 1.7%).
| Demographics | Rating | Rank | Disability Age Under 5 |
| Brazilians | 0.0 /100 | #275 | Tragic 1.5% |
| Greeks | 0.0 /100 | #276 | Tragic 1.5% |
| Canadians | 0.0 /100 | #277 | Tragic 1.5% |
| Kiowa | 0.0 /100 | #278 | Tragic 1.5% |
| Danes | 0.0 /100 | #279 | Tragic 1.5% |
| British | 0.0 /100 | #280 | Tragic 1.5% |
| Czechoslovakians | 0.0 /100 | #281 | Tragic 1.5% |
| Cheyenne | 0.0 /100 | #282 | Tragic 1.5% |
| Delaware | 0.0 /100 | #283 | Tragic 1.5% |
| Europeans | 0.0 /100 | #284 | Tragic 1.5% |
| Croatians | 0.0 /100 | #285 | Tragic 1.5% |
| Tlingit-Haida | 0.0 /100 | #286 | Tragic 1.5% |
| Scandinavians | 0.0 /100 | #287 | Tragic 1.5% |
| Estonians | 0.0 /100 | #288 | Tragic 1.5% |
| Hungarians | 0.0 /100 | #289 | Tragic 1.5% |
Demographics Similar to Immigrants from Norway by Disability Age Under 5
In terms of disability age under 5, the demographic groups most similar to Immigrants from Norway are Immigrants from Somalia (1.3%, a difference of 0.030%), Immigrants from Belgium (1.3%, a difference of 0.040%), Jamaican (1.3%, a difference of 0.040%), U.S. Virgin Islander (1.3%, a difference of 0.34%), and Immigrants from North Macedonia (1.3%, a difference of 0.37%).
| Demographics | Rating | Rank | Disability Age Under 5 |
| Mexican American Indians | 36.6 /100 | #191 | Fair 1.3% |
| Immigrants | Bosnia and Herzegovina | 36.5 /100 | #192 | Fair 1.3% |
| Immigrants | Sierra Leone | 36.5 /100 | #193 | Fair 1.3% |
| Immigrants | North Macedonia | 34.7 /100 | #194 | Fair 1.3% |
| U.S. Virgin Islanders | 34.4 /100 | #195 | Fair 1.3% |
| Immigrants | Belgium | 31.4 /100 | #196 | Fair 1.3% |
| Immigrants | Somalia | 31.3 /100 | #197 | Fair 1.3% |
| Immigrants | Norway | 31.1 /100 | #198 | Fair 1.3% |
| Jamaicans | 30.7 /100 | #199 | Fair 1.3% |
| Immigrants | Lithuania | 27.2 /100 | #200 | Fair 1.3% |
| Immigrants | Italy | 25.4 /100 | #201 | Fair 1.3% |
| Arapaho | 24.1 /100 | #202 | Fair 1.3% |
| Liberians | 24.0 /100 | #203 | Fair 1.3% |
| Immigrants | Europe | 23.6 /100 | #204 | Fair 1.3% |
| Romanians | 22.5 /100 | #205 | Fair 1.3% |