Cheyenne vs Irish Disability Age Under 5
COMPARE
Cheyenne
Irish
Disability Age Under 5
Disability Age Under 5 Comparison
Cheyenne
Irish
1.5%
DISABILITY AGE UNDER 5
0.0/ 100
METRIC RATING
282nd/ 347
METRIC RANK
1.7%
DISABILITY AGE UNDER 5
0.0/ 100
METRIC RATING
318th/ 347
METRIC RANK
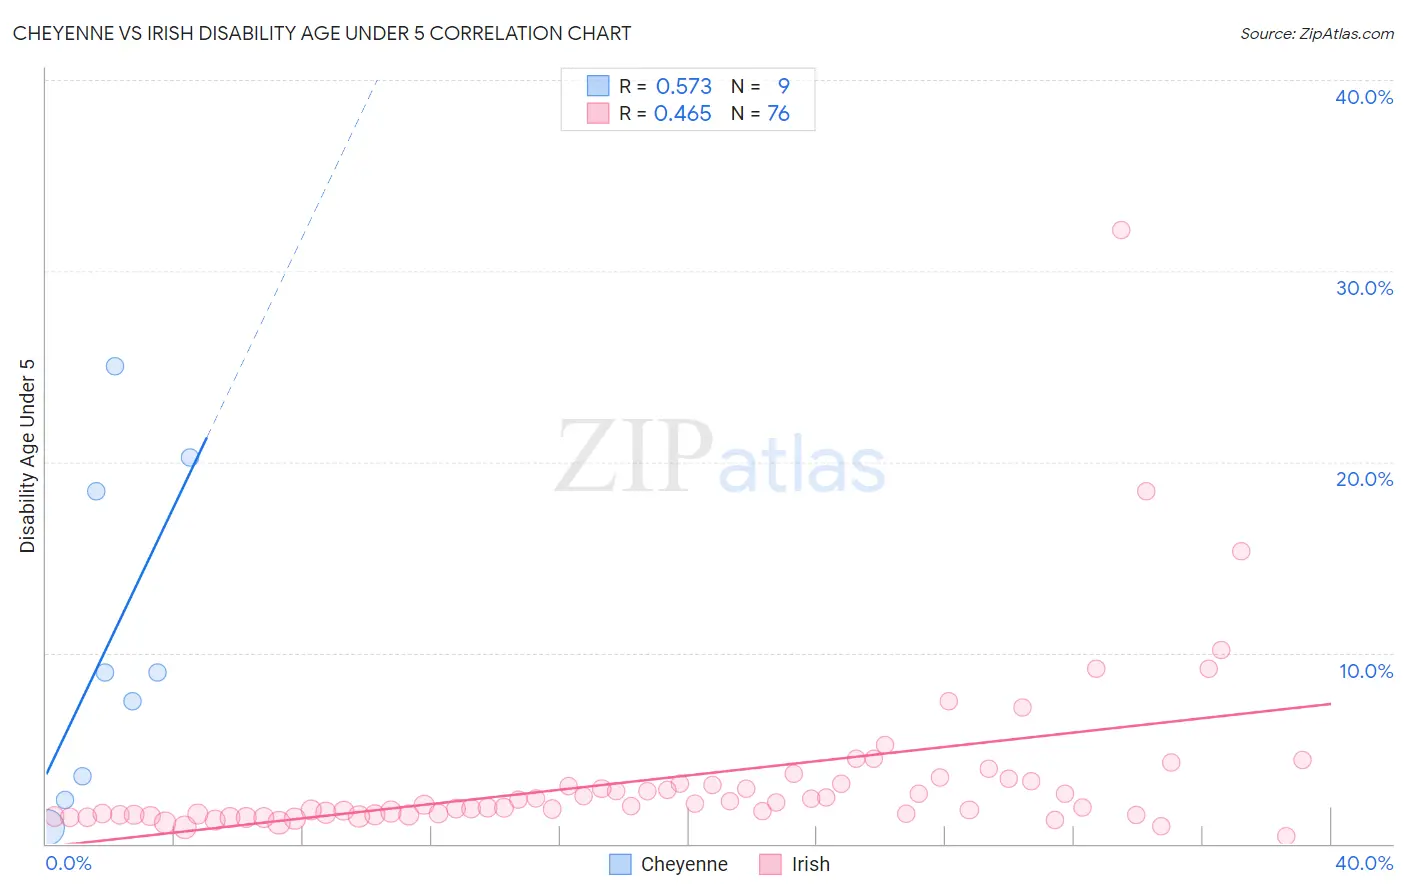
Cheyenne vs Irish Disability Age Under 5 Correlation Chart
The statistical analysis conducted on geographies consisting of 66,176,849 people shows a substantial positive correlation between the proportion of Cheyenne and percentage of population with a disability under the age of 5 in the United States with a correlation coefficient (R) of 0.573 and weighted average of 1.5%. Similarly, the statistical analysis conducted on geographies consisting of 261,602,984 people shows a moderate positive correlation between the proportion of Irish and percentage of population with a disability under the age of 5 in the United States with a correlation coefficient (R) of 0.465 and weighted average of 1.7%, a difference of 11.8%.
Disability Age Under 5 Correlation Summary
| Measurement | Cheyenne | Irish |
| Minimum | 0.85% | 0.37% |
| Maximum | 25.0% | 32.1% |
| Range | 24.1% | 31.8% |
| Mean | 10.6% | 3.4% |
| Median | 9.0% | 2.0% |
| Interquartile 25% (IQ1) | 2.9% | 1.5% |
| Interquartile 75% (IQ3) | 19.4% | 3.2% |
| Interquartile Range (IQR) | 16.4% | 1.6% |
| Standard Deviation (Sample) | 8.6% | 4.5% |
| Standard Deviation (Population) | 8.1% | 4.4% |
Similar Demographics by Disability Age Under 5
Demographics Similar to Cheyenne by Disability Age Under 5
In terms of disability age under 5, the demographic groups most similar to Cheyenne are Delaware (1.5%, a difference of 0.19%), European (1.5%, a difference of 0.25%), Czechoslovakian (1.5%, a difference of 0.34%), Croatian (1.5%, a difference of 1.4%), and Tlingit-Haida (1.5%, a difference of 1.7%).
| Demographics | Rating | Rank | Disability Age Under 5 |
| Brazilians | 0.0 /100 | #275 | Tragic 1.5% |
| Greeks | 0.0 /100 | #276 | Tragic 1.5% |
| Canadians | 0.0 /100 | #277 | Tragic 1.5% |
| Kiowa | 0.0 /100 | #278 | Tragic 1.5% |
| Danes | 0.0 /100 | #279 | Tragic 1.5% |
| British | 0.0 /100 | #280 | Tragic 1.5% |
| Czechoslovakians | 0.0 /100 | #281 | Tragic 1.5% |
| Cheyenne | 0.0 /100 | #282 | Tragic 1.5% |
| Delaware | 0.0 /100 | #283 | Tragic 1.5% |
| Europeans | 0.0 /100 | #284 | Tragic 1.5% |
| Croatians | 0.0 /100 | #285 | Tragic 1.5% |
| Tlingit-Haida | 0.0 /100 | #286 | Tragic 1.5% |
| Scandinavians | 0.0 /100 | #287 | Tragic 1.5% |
| Estonians | 0.0 /100 | #288 | Tragic 1.5% |
| Hungarians | 0.0 /100 | #289 | Tragic 1.5% |
Demographics Similar to Irish by Disability Age Under 5
In terms of disability age under 5, the demographic groups most similar to Irish are French (1.7%, a difference of 0.27%), Slovak (1.7%, a difference of 0.31%), Immigrants from Cabo Verde (1.7%, a difference of 0.69%), Scotch-Irish (1.7%, a difference of 0.84%), and Dutch (1.7%, a difference of 0.88%).
| Demographics | Rating | Rank | Disability Age Under 5 |
| English | 0.0 /100 | #311 | Tragic 1.7% |
| Puerto Ricans | 0.0 /100 | #312 | Tragic 1.7% |
| Celtics | 0.0 /100 | #313 | Tragic 1.7% |
| Norwegians | 0.0 /100 | #314 | Tragic 1.7% |
| Dutch | 0.0 /100 | #315 | Tragic 1.7% |
| Immigrants | Cabo Verde | 0.0 /100 | #316 | Tragic 1.7% |
| French | 0.0 /100 | #317 | Tragic 1.7% |
| Irish | 0.0 /100 | #318 | Tragic 1.7% |
| Slovaks | 0.0 /100 | #319 | Tragic 1.7% |
| Scotch-Irish | 0.0 /100 | #320 | Tragic 1.7% |
| Ottawa | 0.0 /100 | #321 | Tragic 1.7% |
| Germans | 0.0 /100 | #322 | Tragic 1.7% |
| Chickasaw | 0.0 /100 | #323 | Tragic 1.7% |
| Cherokee | 0.0 /100 | #324 | Tragic 1.8% |
| Immigrants | Portugal | 0.0 /100 | #325 | Tragic 1.8% |