Cheyenne vs Scandinavian Disability Age Under 5
COMPARE
Cheyenne
Scandinavian
Disability Age Under 5
Disability Age Under 5 Comparison
Cheyenne
Scandinavians
1.5%
DISABILITY AGE UNDER 5
0.0/ 100
METRIC RATING
282nd/ 347
METRIC RANK
1.5%
DISABILITY AGE UNDER 5
0.0/ 100
METRIC RATING
287th/ 347
METRIC RANK
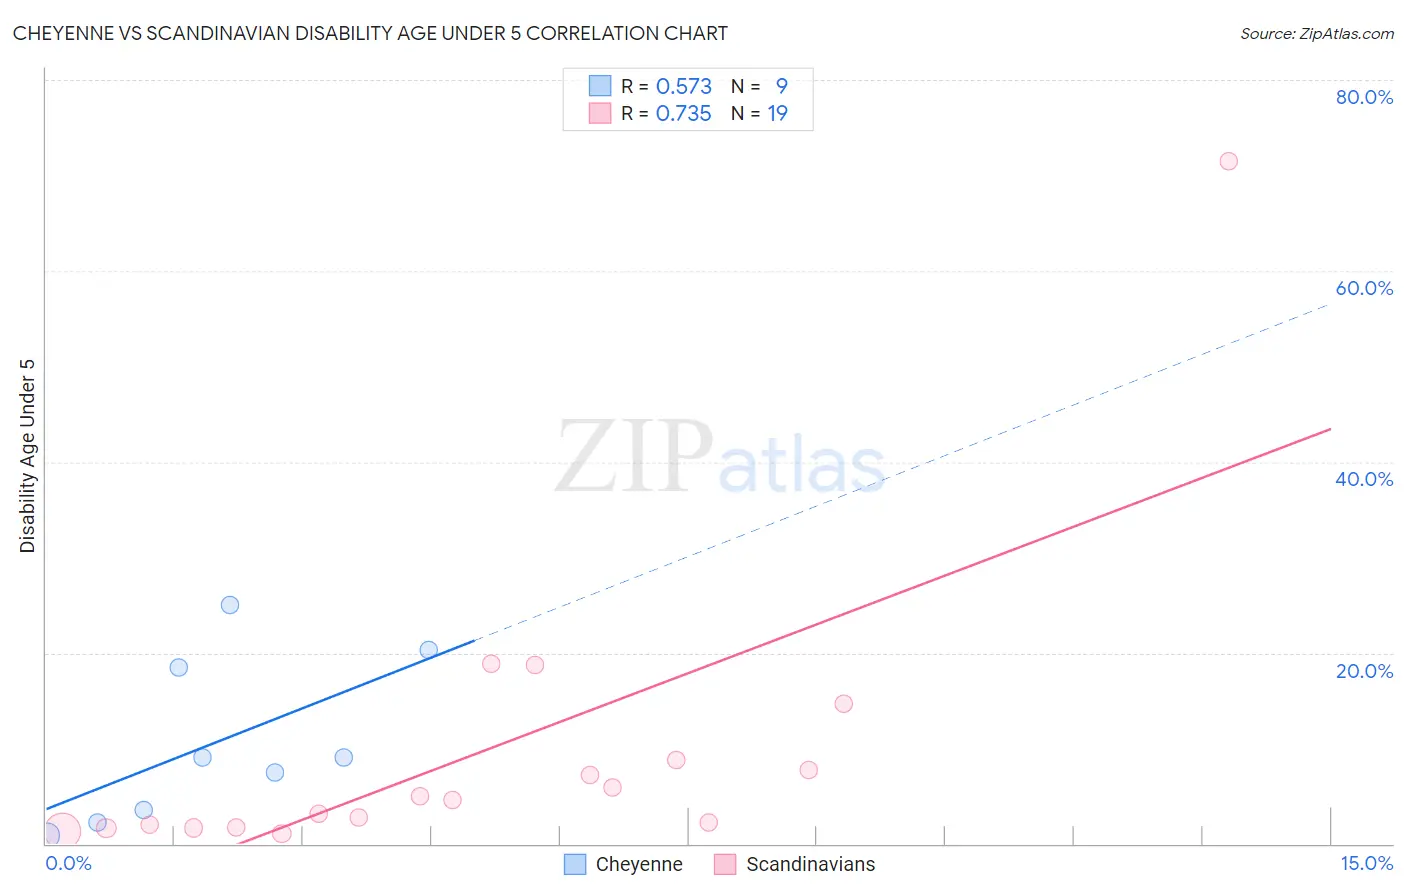
Cheyenne vs Scandinavian Disability Age Under 5 Correlation Chart
The statistical analysis conducted on geographies consisting of 66,176,849 people shows a substantial positive correlation between the proportion of Cheyenne and percentage of population with a disability under the age of 5 in the United States with a correlation coefficient (R) of 0.573 and weighted average of 1.5%. Similarly, the statistical analysis conducted on geographies consisting of 234,208,425 people shows a strong positive correlation between the proportion of Scandinavians and percentage of population with a disability under the age of 5 in the United States with a correlation coefficient (R) of 0.735 and weighted average of 1.5%, a difference of 1.7%.
Disability Age Under 5 Correlation Summary
| Measurement | Cheyenne | Scandinavian |
| Minimum | 0.85% | 1.1% |
| Maximum | 25.0% | 71.4% |
| Range | 24.1% | 70.3% |
| Mean | 10.6% | 9.5% |
| Median | 9.0% | 4.6% |
| Interquartile 25% (IQ1) | 2.9% | 1.7% |
| Interquartile 75% (IQ3) | 19.4% | 8.7% |
| Interquartile Range (IQR) | 16.4% | 7.0% |
| Standard Deviation (Sample) | 8.6% | 16.0% |
| Standard Deviation (Population) | 8.1% | 15.6% |
Demographics Similar to Cheyenne and Scandinavians by Disability Age Under 5
In terms of disability age under 5, the demographic groups most similar to Cheyenne are Delaware (1.5%, a difference of 0.19%), European (1.5%, a difference of 0.25%), Czechoslovakian (1.5%, a difference of 0.34%), Croatian (1.5%, a difference of 1.4%), and Tlingit-Haida (1.5%, a difference of 1.7%). Similarly, the demographic groups most similar to Scandinavians are Tlingit-Haida (1.5%, a difference of 0.050%), Estonian (1.5%, a difference of 0.18%), Croatian (1.5%, a difference of 0.30%), Hungarian (1.5%, a difference of 0.32%), and Czech (1.5%, a difference of 0.45%).
| Demographics | Rating | Rank | Disability Age Under 5 |
| Iroquois | 0.0 /100 | #274 | Tragic 1.5% |
| Brazilians | 0.0 /100 | #275 | Tragic 1.5% |
| Greeks | 0.0 /100 | #276 | Tragic 1.5% |
| Canadians | 0.0 /100 | #277 | Tragic 1.5% |
| Kiowa | 0.0 /100 | #278 | Tragic 1.5% |
| Danes | 0.0 /100 | #279 | Tragic 1.5% |
| British | 0.0 /100 | #280 | Tragic 1.5% |
| Czechoslovakians | 0.0 /100 | #281 | Tragic 1.5% |
| Cheyenne | 0.0 /100 | #282 | Tragic 1.5% |
| Delaware | 0.0 /100 | #283 | Tragic 1.5% |
| Europeans | 0.0 /100 | #284 | Tragic 1.5% |
| Croatians | 0.0 /100 | #285 | Tragic 1.5% |
| Tlingit-Haida | 0.0 /100 | #286 | Tragic 1.5% |
| Scandinavians | 0.0 /100 | #287 | Tragic 1.5% |
| Estonians | 0.0 /100 | #288 | Tragic 1.5% |
| Hungarians | 0.0 /100 | #289 | Tragic 1.5% |
| Czechs | 0.0 /100 | #290 | Tragic 1.5% |
| Northern Europeans | 0.0 /100 | #291 | Tragic 1.6% |
| Italians | 0.0 /100 | #292 | Tragic 1.6% |
| Lithuanians | 0.0 /100 | #293 | Tragic 1.6% |
| Swedes | 0.0 /100 | #294 | Tragic 1.6% |