Cheyenne vs Greek Disability Age Under 5
COMPARE
Cheyenne
Greek
Disability Age Under 5
Disability Age Under 5 Comparison
Cheyenne
Greeks
1.5%
DISABILITY AGE UNDER 5
0.0/ 100
METRIC RATING
282nd/ 347
METRIC RANK
1.5%
DISABILITY AGE UNDER 5
0.0/ 100
METRIC RATING
276th/ 347
METRIC RANK
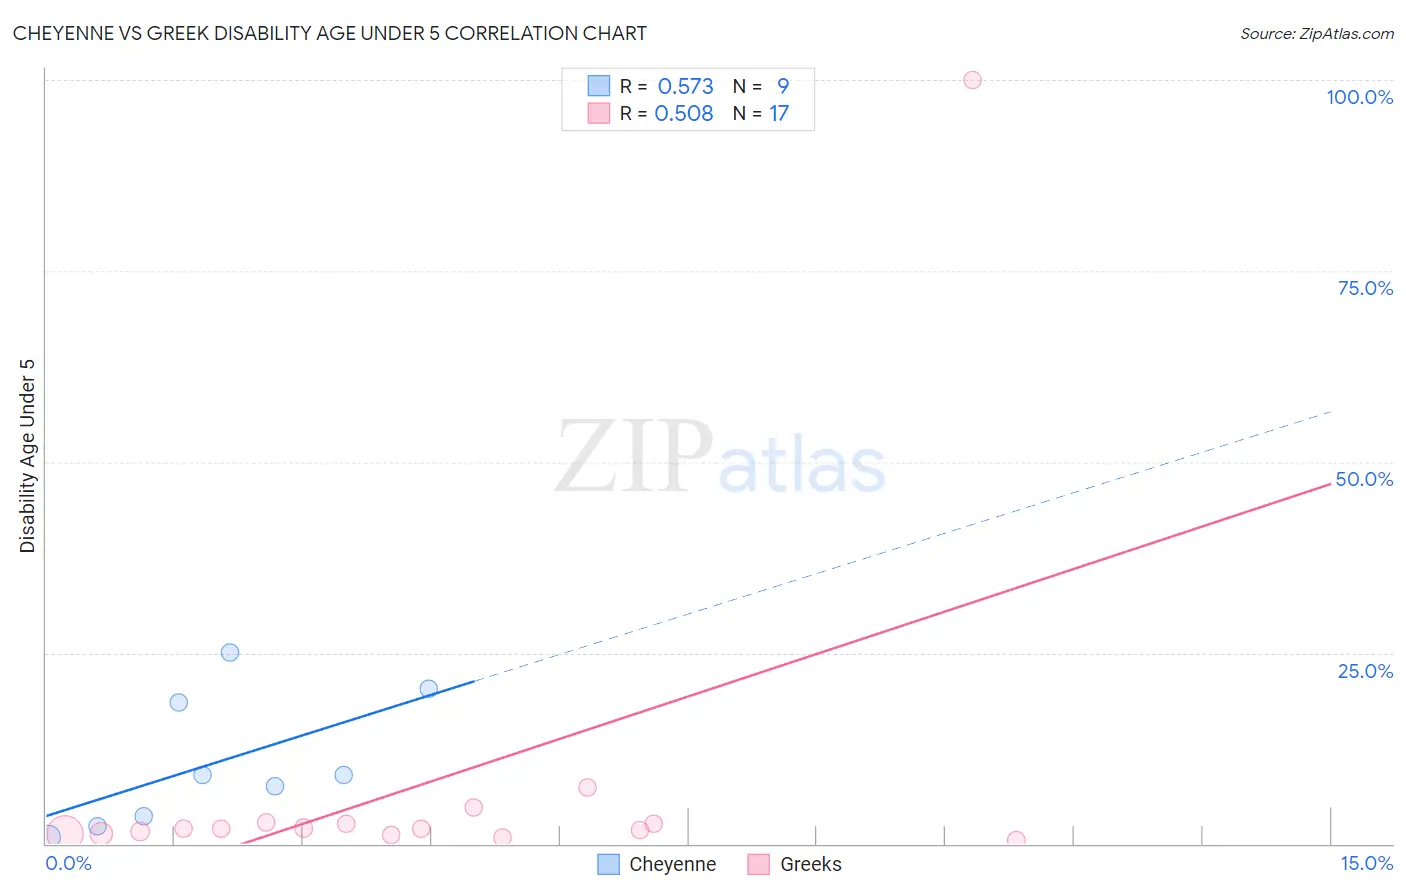
Cheyenne vs Greek Disability Age Under 5 Correlation Chart
The statistical analysis conducted on geographies consisting of 66,176,849 people shows a substantial positive correlation between the proportion of Cheyenne and percentage of population with a disability under the age of 5 in the United States with a correlation coefficient (R) of 0.573 and weighted average of 1.5%. Similarly, the statistical analysis conducted on geographies consisting of 239,993,794 people shows a substantial positive correlation between the proportion of Greeks and percentage of population with a disability under the age of 5 in the United States with a correlation coefficient (R) of 0.508 and weighted average of 1.5%, a difference of 3.6%.
Disability Age Under 5 Correlation Summary
| Measurement | Cheyenne | Greek |
| Minimum | 0.85% | 0.57% |
| Maximum | 25.0% | 100.0% |
| Range | 24.1% | 99.4% |
| Mean | 10.6% | 8.0% |
| Median | 9.0% | 2.0% |
| Interquartile 25% (IQ1) | 2.9% | 1.3% |
| Interquartile 75% (IQ3) | 19.4% | 2.7% |
| Interquartile Range (IQR) | 16.4% | 1.4% |
| Standard Deviation (Sample) | 8.6% | 23.8% |
| Standard Deviation (Population) | 8.1% | 23.0% |
Demographics Similar to Cheyenne and Greeks by Disability Age Under 5
In terms of disability age under 5, the demographic groups most similar to Cheyenne are Delaware (1.5%, a difference of 0.19%), European (1.5%, a difference of 0.25%), Czechoslovakian (1.5%, a difference of 0.34%), Croatian (1.5%, a difference of 1.4%), and Tlingit-Haida (1.5%, a difference of 1.7%). Similarly, the demographic groups most similar to Greeks are Brazilian (1.5%, a difference of 0.57%), Iroquois (1.5%, a difference of 0.69%), Canadian (1.5%, a difference of 0.70%), Kiowa (1.5%, a difference of 0.78%), and Danish (1.5%, a difference of 0.79%).
| Demographics | Rating | Rank | Disability Age Under 5 |
| Austrians | 0.1 /100 | #269 | Tragic 1.4% |
| Immigrants | North America | 0.1 /100 | #270 | Tragic 1.4% |
| Immigrants | Canada | 0.1 /100 | #271 | Tragic 1.4% |
| Blacks/African Americans | 0.1 /100 | #272 | Tragic 1.4% |
| Alaskan Athabascans | 0.1 /100 | #273 | Tragic 1.5% |
| Iroquois | 0.0 /100 | #274 | Tragic 1.5% |
| Brazilians | 0.0 /100 | #275 | Tragic 1.5% |
| Greeks | 0.0 /100 | #276 | Tragic 1.5% |
| Canadians | 0.0 /100 | #277 | Tragic 1.5% |
| Kiowa | 0.0 /100 | #278 | Tragic 1.5% |
| Danes | 0.0 /100 | #279 | Tragic 1.5% |
| British | 0.0 /100 | #280 | Tragic 1.5% |
| Czechoslovakians | 0.0 /100 | #281 | Tragic 1.5% |
| Cheyenne | 0.0 /100 | #282 | Tragic 1.5% |
| Delaware | 0.0 /100 | #283 | Tragic 1.5% |
| Europeans | 0.0 /100 | #284 | Tragic 1.5% |
| Croatians | 0.0 /100 | #285 | Tragic 1.5% |
| Tlingit-Haida | 0.0 /100 | #286 | Tragic 1.5% |
| Scandinavians | 0.0 /100 | #287 | Tragic 1.5% |
| Estonians | 0.0 /100 | #288 | Tragic 1.5% |
| Hungarians | 0.0 /100 | #289 | Tragic 1.5% |