Yaqui vs Immigrants from Norway Disability Age Under 5
COMPARE
Yaqui
Immigrants from Norway
Disability Age Under 5
Disability Age Under 5 Comparison
Yaqui
Immigrants from Norway
1.2%
DISABILITY AGE UNDER 5
74.8/ 100
METRIC RATING
151st/ 347
METRIC RANK
1.3%
DISABILITY AGE UNDER 5
31.1/ 100
METRIC RATING
198th/ 347
METRIC RANK
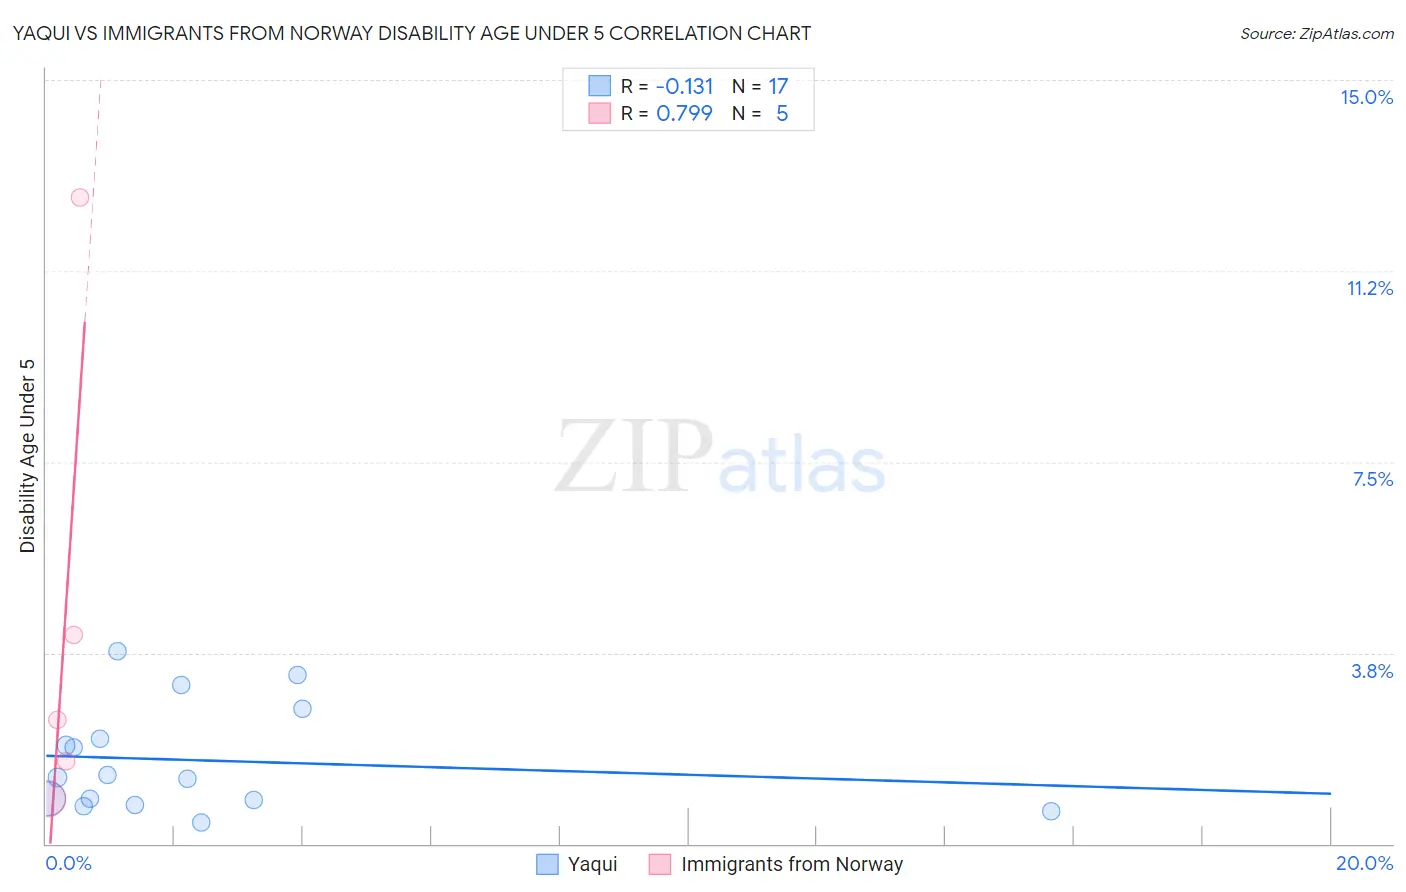
Yaqui vs Immigrants from Norway Disability Age Under 5 Correlation Chart
The statistical analysis conducted on geographies consisting of 82,785,563 people shows a poor negative correlation between the proportion of Yaqui and percentage of population with a disability under the age of 5 in the United States with a correlation coefficient (R) of -0.131 and weighted average of 1.2%. Similarly, the statistical analysis conducted on geographies consisting of 84,343,493 people shows a strong positive correlation between the proportion of Immigrants from Norway and percentage of population with a disability under the age of 5 in the United States with a correlation coefficient (R) of 0.799 and weighted average of 1.3%, a difference of 4.4%.
Disability Age Under 5 Correlation Summary
| Measurement | Yaqui | Immigrants from Norway |
| Minimum | 0.41% | 0.87% |
| Maximum | 3.8% | 12.7% |
| Range | 3.4% | 11.8% |
| Mean | 1.6% | 4.3% |
| Median | 1.3% | 2.4% |
| Interquartile 25% (IQ1) | 0.81% | 1.2% |
| Interquartile 75% (IQ3) | 2.4% | 8.4% |
| Interquartile Range (IQR) | 1.6% | 7.2% |
| Standard Deviation (Sample) | 1.0% | 4.8% |
| Standard Deviation (Population) | 1.0% | 4.3% |
Similar Demographics by Disability Age Under 5
Demographics Similar to Yaqui by Disability Age Under 5
In terms of disability age under 5, the demographic groups most similar to Yaqui are South American (1.2%, a difference of 0.10%), Kenyan (1.2%, a difference of 0.14%), Ghanaian (1.2%, a difference of 0.19%), Icelander (1.2%, a difference of 0.20%), and Honduran (1.2%, a difference of 0.28%).
| Demographics | Rating | Rank | Disability Age Under 5 |
| Immigrants | Middle Africa | 79.3 /100 | #144 | Good 1.2% |
| Immigrants | Zimbabwe | 77.9 /100 | #145 | Good 1.2% |
| Samoans | 77.7 /100 | #146 | Good 1.2% |
| Icelanders | 76.3 /100 | #147 | Good 1.2% |
| Ghanaians | 76.3 /100 | #148 | Good 1.2% |
| Kenyans | 75.9 /100 | #149 | Good 1.2% |
| South Americans | 75.6 /100 | #150 | Good 1.2% |
| Yaqui | 74.8 /100 | #151 | Good 1.2% |
| Hondurans | 72.5 /100 | #152 | Good 1.2% |
| Immigrants | Thailand | 69.4 /100 | #153 | Good 1.2% |
| Uruguayans | 68.8 /100 | #154 | Good 1.2% |
| Immigrants | Ghana | 68.7 /100 | #155 | Good 1.2% |
| Hawaiians | 68.5 /100 | #156 | Good 1.2% |
| Immigrants | South America | 67.0 /100 | #157 | Good 1.2% |
| Arabs | 66.4 /100 | #158 | Good 1.2% |
Demographics Similar to Immigrants from Norway by Disability Age Under 5
In terms of disability age under 5, the demographic groups most similar to Immigrants from Norway are Immigrants from Somalia (1.3%, a difference of 0.030%), Immigrants from Belgium (1.3%, a difference of 0.040%), Jamaican (1.3%, a difference of 0.040%), U.S. Virgin Islander (1.3%, a difference of 0.34%), and Immigrants from North Macedonia (1.3%, a difference of 0.37%).
| Demographics | Rating | Rank | Disability Age Under 5 |
| Mexican American Indians | 36.6 /100 | #191 | Fair 1.3% |
| Immigrants | Bosnia and Herzegovina | 36.5 /100 | #192 | Fair 1.3% |
| Immigrants | Sierra Leone | 36.5 /100 | #193 | Fair 1.3% |
| Immigrants | North Macedonia | 34.7 /100 | #194 | Fair 1.3% |
| U.S. Virgin Islanders | 34.4 /100 | #195 | Fair 1.3% |
| Immigrants | Belgium | 31.4 /100 | #196 | Fair 1.3% |
| Immigrants | Somalia | 31.3 /100 | #197 | Fair 1.3% |
| Immigrants | Norway | 31.1 /100 | #198 | Fair 1.3% |
| Jamaicans | 30.7 /100 | #199 | Fair 1.3% |
| Immigrants | Lithuania | 27.2 /100 | #200 | Fair 1.3% |
| Immigrants | Italy | 25.4 /100 | #201 | Fair 1.3% |
| Arapaho | 24.1 /100 | #202 | Fair 1.3% |
| Liberians | 24.0 /100 | #203 | Fair 1.3% |
| Immigrants | Europe | 23.6 /100 | #204 | Fair 1.3% |
| Romanians | 22.5 /100 | #205 | Fair 1.3% |