Cheyenne vs Immigrants from Norway Doctorate Degree
COMPARE
Cheyenne
Immigrants from Norway
Doctorate Degree
Doctorate Degree Comparison
Cheyenne
Immigrants from Norway
1.6%
DOCTORATE DEGREE
2.3/ 100
METRIC RATING
241st/ 347
METRIC RANK
2.4%
DOCTORATE DEGREE
100.0/ 100
METRIC RATING
50th/ 347
METRIC RANK
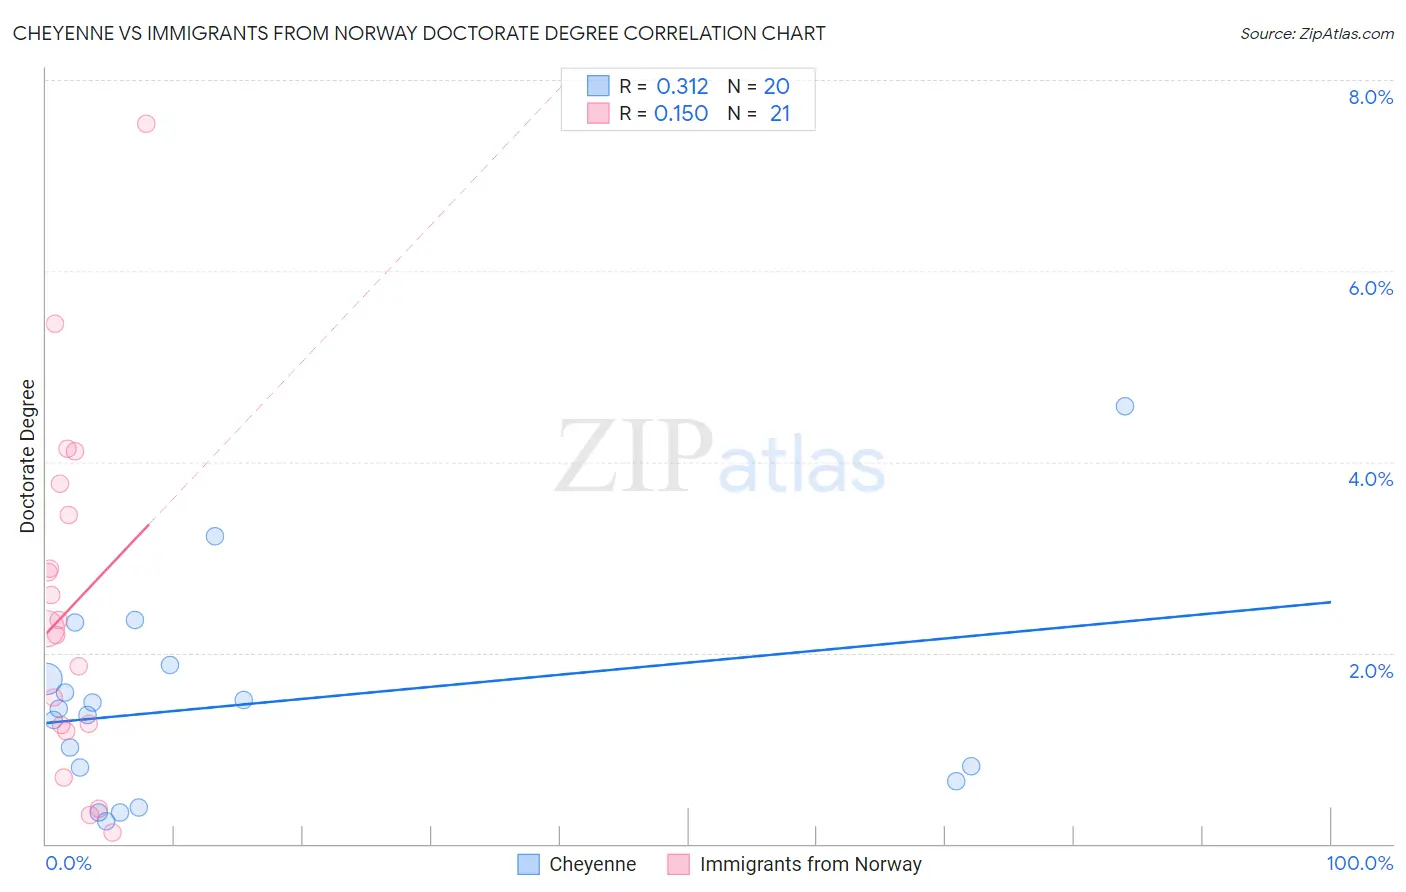
Cheyenne vs Immigrants from Norway Doctorate Degree Correlation Chart
The statistical analysis conducted on geographies consisting of 80,230,104 people shows a mild positive correlation between the proportion of Cheyenne and percentage of population with at least doctorate degree education in the United States with a correlation coefficient (R) of 0.312 and weighted average of 1.6%. Similarly, the statistical analysis conducted on geographies consisting of 116,506,510 people shows a poor positive correlation between the proportion of Immigrants from Norway and percentage of population with at least doctorate degree education in the United States with a correlation coefficient (R) of 0.150 and weighted average of 2.4%, a difference of 51.2%.
Doctorate Degree Correlation Summary
| Measurement | Cheyenne | Immigrants from Norway |
| Minimum | 0.23% | 0.12% |
| Maximum | 4.6% | 7.5% |
| Range | 4.4% | 7.4% |
| Mean | 1.5% | 2.5% |
| Median | 1.4% | 2.3% |
| Interquartile 25% (IQ1) | 0.72% | 1.2% |
| Interquartile 75% (IQ3) | 1.8% | 3.6% |
| Interquartile Range (IQR) | 1.1% | 2.4% |
| Standard Deviation (Sample) | 1.1% | 1.8% |
| Standard Deviation (Population) | 1.0% | 1.8% |
Similar Demographics by Doctorate Degree
Demographics Similar to Cheyenne by Doctorate Degree
In terms of doctorate degree, the demographic groups most similar to Cheyenne are Immigrants from Panama (1.6%, a difference of 0.19%), Ottawa (1.6%, a difference of 0.21%), Native Hawaiian (1.6%, a difference of 0.34%), West Indian (1.6%, a difference of 0.38%), and Immigrants from Congo (1.6%, a difference of 0.48%).
| Demographics | Rating | Rank | Doctorate Degree |
| Hopi | 3.2 /100 | #234 | Tragic 1.6% |
| Cree | 3.0 /100 | #235 | Tragic 1.6% |
| Indonesians | 2.8 /100 | #236 | Tragic 1.6% |
| Iroquois | 2.7 /100 | #237 | Tragic 1.6% |
| Immigrants | Congo | 2.6 /100 | #238 | Tragic 1.6% |
| West Indians | 2.5 /100 | #239 | Tragic 1.6% |
| Immigrants | Panama | 2.4 /100 | #240 | Tragic 1.6% |
| Cheyenne | 2.3 /100 | #241 | Tragic 1.6% |
| Ottawa | 2.2 /100 | #242 | Tragic 1.6% |
| Native Hawaiians | 2.1 /100 | #243 | Tragic 1.6% |
| French American Indians | 2.0 /100 | #244 | Tragic 1.6% |
| Delaware | 1.9 /100 | #245 | Tragic 1.6% |
| Hmong | 1.8 /100 | #246 | Tragic 1.6% |
| Comanche | 1.8 /100 | #247 | Tragic 1.6% |
| Africans | 1.8 /100 | #248 | Tragic 1.6% |
Demographics Similar to Immigrants from Norway by Doctorate Degree
In terms of doctorate degree, the demographic groups most similar to Immigrants from Norway are Australian (2.4%, a difference of 0.090%), Bulgarian (2.4%, a difference of 0.56%), Immigrants from Latvia (2.4%, a difference of 0.68%), Immigrants from Asia (2.4%, a difference of 1.1%), and Asian (2.4%, a difference of 1.3%).
| Demographics | Rating | Rank | Doctorate Degree |
| Soviet Union | 100.0 /100 | #43 | Exceptional 2.5% |
| Immigrants | Netherlands | 100.0 /100 | #44 | Exceptional 2.5% |
| Immigrants | South Africa | 100.0 /100 | #45 | Exceptional 2.4% |
| Immigrants | Austria | 100.0 /100 | #46 | Exceptional 2.4% |
| Immigrants | Western Europe | 100.0 /100 | #47 | Exceptional 2.4% |
| Asians | 100.0 /100 | #48 | Exceptional 2.4% |
| Immigrants | Asia | 100.0 /100 | #49 | Exceptional 2.4% |
| Immigrants | Norway | 100.0 /100 | #50 | Exceptional 2.4% |
| Australians | 100.0 /100 | #51 | Exceptional 2.4% |
| Bulgarians | 100.0 /100 | #52 | Exceptional 2.4% |
| Immigrants | Latvia | 100.0 /100 | #53 | Exceptional 2.4% |
| Immigrants | Indonesia | 100.0 /100 | #54 | Exceptional 2.4% |
| Bolivians | 100.0 /100 | #55 | Exceptional 2.4% |
| Immigrants | Czechoslovakia | 100.0 /100 | #56 | Exceptional 2.4% |
| Immigrants | Ethiopia | 100.0 /100 | #57 | Exceptional 2.4% |