Celtic vs Immigrants from Western Asia 4 or more Vehicles in Household
COMPARE
Celtic
Immigrants from Western Asia
4 or more Vehicles in Household
4 or more Vehicles in Household Comparison
Celtics
Immigrants from Western Asia
7.1%
4 OR MORE VEHICLES IN HOUSEHOLD
99.1/ 100
METRIC RATING
97th/ 347
METRIC RANK
5.9%
4 OR MORE VEHICLES IN HOUSEHOLD
7.8/ 100
METRIC RATING
227th/ 347
METRIC RANK
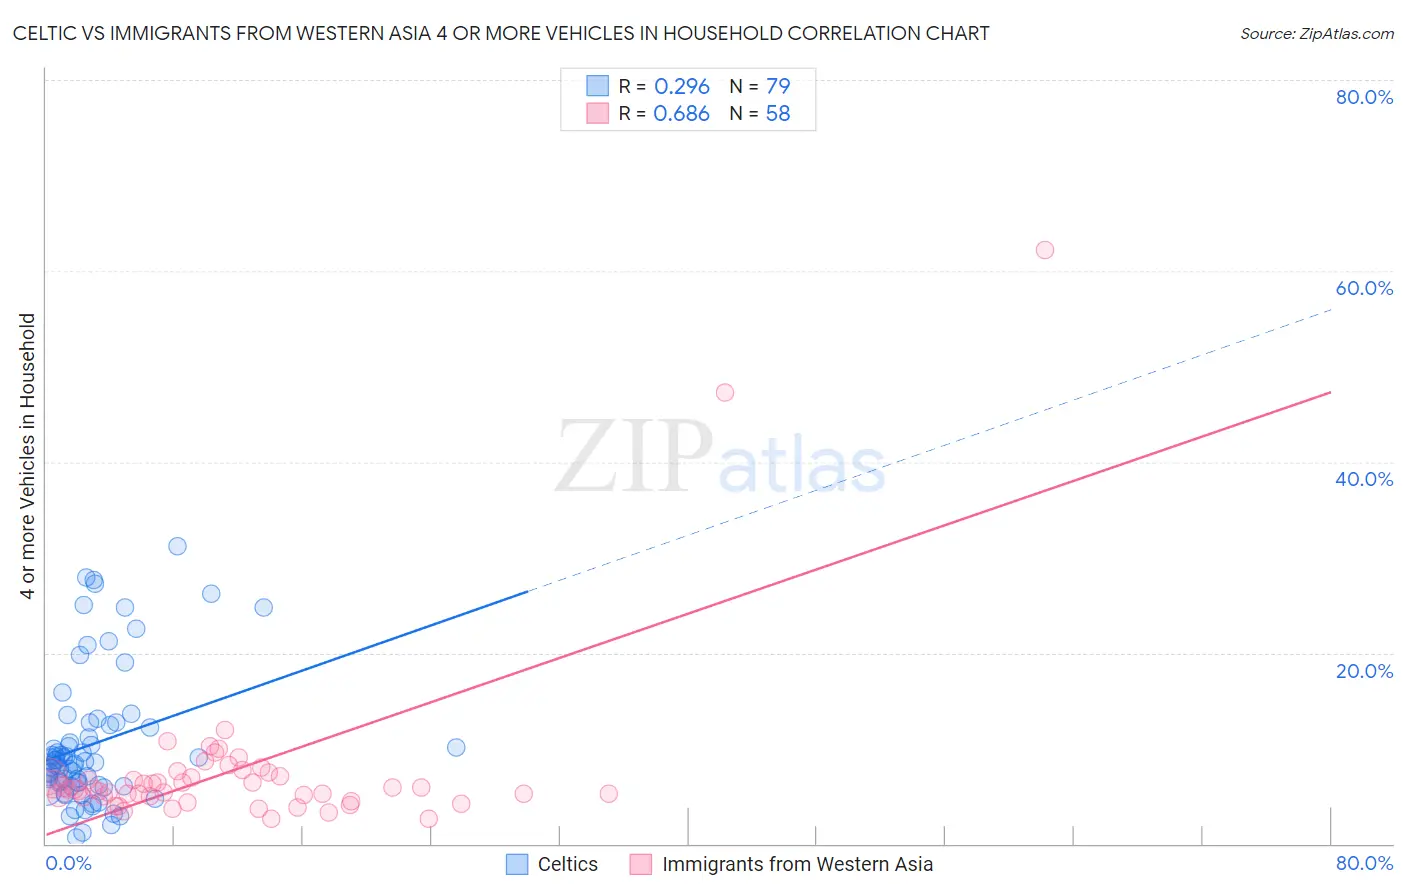
Celtic vs Immigrants from Western Asia 4 or more Vehicles in Household Correlation Chart
The statistical analysis conducted on geographies consisting of 168,678,221 people shows a weak positive correlation between the proportion of Celtics and percentage of households with 4 or more vehicles available in the United States with a correlation coefficient (R) of 0.296 and weighted average of 7.1%. Similarly, the statistical analysis conducted on geographies consisting of 402,393,776 people shows a significant positive correlation between the proportion of Immigrants from Western Asia and percentage of households with 4 or more vehicles available in the United States with a correlation coefficient (R) of 0.686 and weighted average of 5.9%, a difference of 19.5%.
4 or more Vehicles in Household Correlation Summary
| Measurement | Celtic | Immigrants from Western Asia |
| Minimum | 0.62% | 2.6% |
| Maximum | 31.2% | 62.2% |
| Range | 30.6% | 59.5% |
| Mean | 10.5% | 7.7% |
| Median | 8.5% | 5.8% |
| Interquartile 25% (IQ1) | 6.1% | 5.0% |
| Interquartile 75% (IQ3) | 12.5% | 7.1% |
| Interquartile Range (IQR) | 6.3% | 2.1% |
| Standard Deviation (Sample) | 7.0% | 9.3% |
| Standard Deviation (Population) | 7.0% | 9.2% |
Similar Demographics by 4 or more Vehicles in Household
Demographics Similar to Celtics by 4 or more Vehicles in Household
In terms of 4 or more vehicles in household, the demographic groups most similar to Celtics are Central American (7.1%, a difference of 0.35%), Czechoslovakian (7.1%, a difference of 0.37%), Irish (7.1%, a difference of 0.42%), Dutch West Indian (7.1%, a difference of 0.58%), and Immigrants from Afghanistan (7.1%, a difference of 0.59%).
| Demographics | Rating | Rank | 4 or more Vehicles in Household |
| Creek | 99.6 /100 | #90 | Exceptional 7.2% |
| Assyrians/Chaldeans/Syriacs | 99.4 /100 | #91 | Exceptional 7.2% |
| Immigrants | Latin America | 99.4 /100 | #92 | Exceptional 7.1% |
| Immigrants | Afghanistan | 99.3 /100 | #93 | Exceptional 7.1% |
| Dutch West Indians | 99.3 /100 | #94 | Exceptional 7.1% |
| Czechoslovakians | 99.3 /100 | #95 | Exceptional 7.1% |
| Central Americans | 99.3 /100 | #96 | Exceptional 7.1% |
| Celtics | 99.1 /100 | #97 | Exceptional 7.1% |
| Irish | 99.0 /100 | #98 | Exceptional 7.1% |
| Seminole | 98.8 /100 | #99 | Exceptional 7.0% |
| Taiwanese | 98.7 /100 | #100 | Exceptional 7.0% |
| Pakistanis | 98.7 /100 | #101 | Exceptional 7.0% |
| Asians | 98.6 /100 | #102 | Exceptional 7.0% |
| Blackfeet | 98.6 /100 | #103 | Exceptional 7.0% |
| Hmong | 98.3 /100 | #104 | Exceptional 7.0% |
Demographics Similar to Immigrants from Western Asia by 4 or more Vehicles in Household
In terms of 4 or more vehicles in household, the demographic groups most similar to Immigrants from Western Asia are Immigrants from Singapore (5.9%, a difference of 0.040%), Immigrants from Uganda (5.9%, a difference of 0.090%), Eastern European (5.9%, a difference of 0.38%), Indonesian (6.0%, a difference of 0.41%), and Immigrants from Malaysia (5.9%, a difference of 0.44%).
| Demographics | Rating | Rank | 4 or more Vehicles in Household |
| Russians | 10.3 /100 | #220 | Poor 6.0% |
| Immigrants | Moldova | 9.3 /100 | #221 | Tragic 6.0% |
| Cajuns | 9.2 /100 | #222 | Tragic 6.0% |
| Immigrants | Kenya | 9.2 /100 | #223 | Tragic 6.0% |
| Cubans | 9.2 /100 | #224 | Tragic 6.0% |
| Indonesians | 8.9 /100 | #225 | Tragic 6.0% |
| Immigrants | Singapore | 7.9 /100 | #226 | Tragic 5.9% |
| Immigrants | Western Asia | 7.8 /100 | #227 | Tragic 5.9% |
| Immigrants | Uganda | 7.5 /100 | #228 | Tragic 5.9% |
| Eastern Europeans | 6.8 /100 | #229 | Tragic 5.9% |
| Immigrants | Malaysia | 6.7 /100 | #230 | Tragic 5.9% |
| Immigrants | Switzerland | 6.4 /100 | #231 | Tragic 5.9% |
| Immigrants | Argentina | 6.0 /100 | #232 | Tragic 5.9% |
| Sierra Leoneans | 6.0 /100 | #233 | Tragic 5.9% |
| Africans | 4.6 /100 | #234 | Tragic 5.8% |