Armenian vs Immigrants from Western Asia Disability
COMPARE
Armenian
Immigrants from Western Asia
Disability
Disability Comparison
Armenians
Immigrants from Western Asia
11.6%
DISABILITY
65.9/ 100
METRIC RATING
158th/ 347
METRIC RANK
11.2%
DISABILITY
98.1/ 100
METRIC RATING
91st/ 347
METRIC RANK
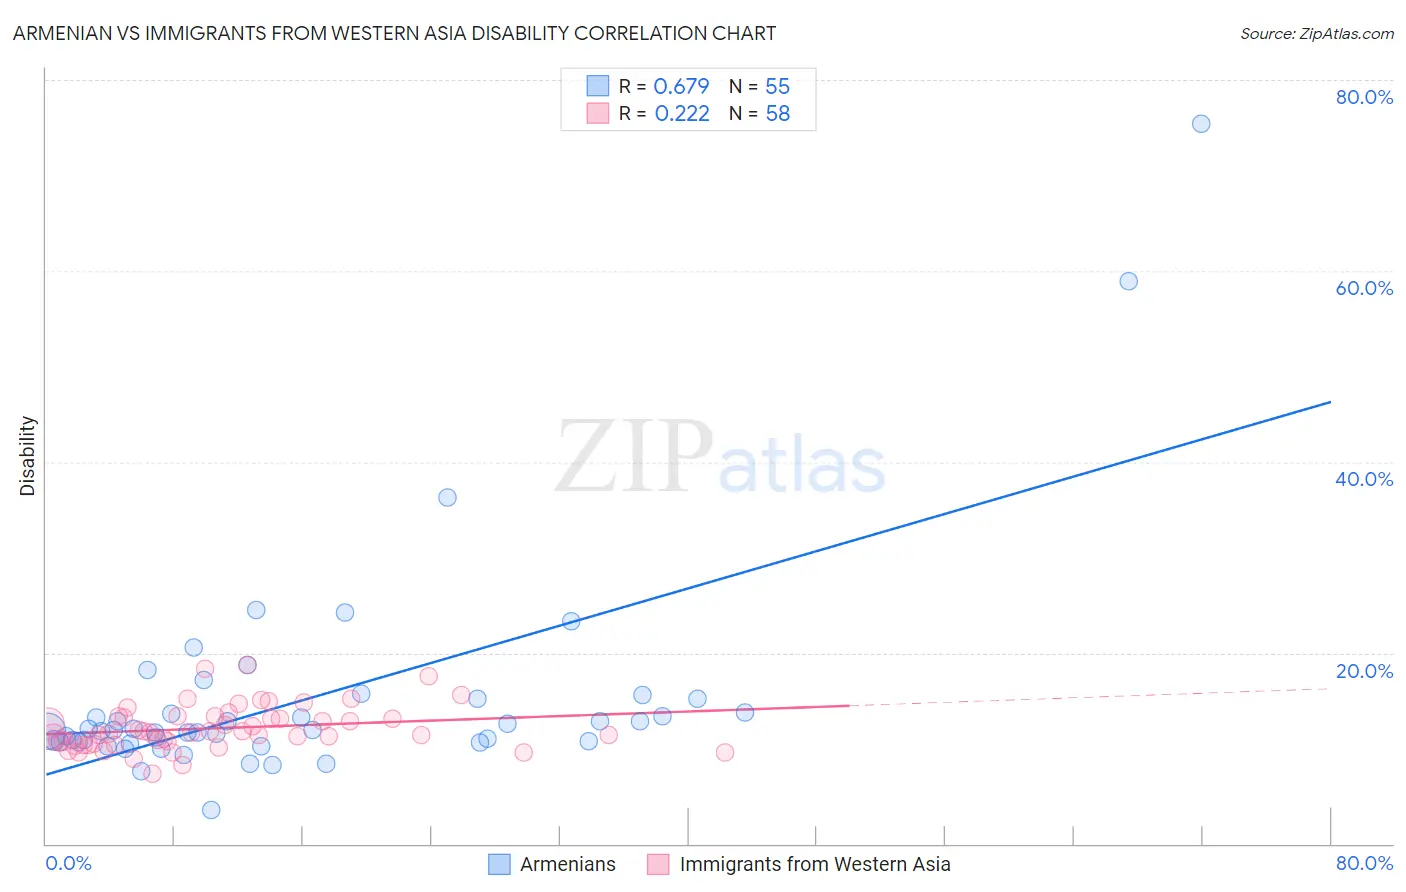
Armenian vs Immigrants from Western Asia Disability Correlation Chart
The statistical analysis conducted on geographies consisting of 310,943,195 people shows a significant positive correlation between the proportion of Armenians and percentage of population with a disability in the United States with a correlation coefficient (R) of 0.679 and weighted average of 11.6%. Similarly, the statistical analysis conducted on geographies consisting of 404,425,808 people shows a weak positive correlation between the proportion of Immigrants from Western Asia and percentage of population with a disability in the United States with a correlation coefficient (R) of 0.222 and weighted average of 11.2%, a difference of 3.8%.
Disability Correlation Summary
| Measurement | Armenian | Immigrants from Western Asia |
| Minimum | 3.6% | 7.4% |
| Maximum | 75.4% | 18.8% |
| Range | 71.8% | 11.4% |
| Mean | 15.1% | 12.1% |
| Median | 11.9% | 11.7% |
| Interquartile 25% (IQ1) | 10.7% | 10.5% |
| Interquartile 75% (IQ3) | 15.1% | 13.4% |
| Interquartile Range (IQR) | 4.4% | 2.8% |
| Standard Deviation (Sample) | 11.5% | 2.3% |
| Standard Deviation (Population) | 11.4% | 2.3% |
Similar Demographics by Disability
Demographics Similar to Armenians by Disability
In terms of disability, the demographic groups most similar to Armenians are Guatemalan (11.6%, a difference of 0.040%), Immigrants from Barbados (11.6%, a difference of 0.080%), Immigrants from Cuba (11.6%, a difference of 0.15%), Immigrants from Middle Africa (11.6%, a difference of 0.18%), and Immigrants from Fiji (11.6%, a difference of 0.19%).
| Demographics | Rating | Rank | Disability |
| Immigrants | Kenya | 72.1 /100 | #151 | Good 11.6% |
| Immigrants | Moldova | 72.0 /100 | #152 | Good 11.6% |
| Immigrants | Ghana | 71.2 /100 | #153 | Good 11.6% |
| Immigrants | Guatemala | 71.1 /100 | #154 | Good 11.6% |
| Immigrants | Netherlands | 69.8 /100 | #155 | Good 11.6% |
| Immigrants | Fiji | 69.5 /100 | #156 | Good 11.6% |
| Immigrants | Middle Africa | 69.5 /100 | #157 | Good 11.6% |
| Armenians | 65.9 /100 | #158 | Good 11.6% |
| Guatemalans | 65.1 /100 | #159 | Good 11.6% |
| Immigrants | Barbados | 64.2 /100 | #160 | Good 11.6% |
| Immigrants | Cuba | 62.8 /100 | #161 | Good 11.6% |
| Immigrants | Haiti | 59.2 /100 | #162 | Average 11.7% |
| Immigrants | Trinidad and Tobago | 58.9 /100 | #163 | Average 11.7% |
| Syrians | 58.5 /100 | #164 | Average 11.7% |
| Cubans | 56.7 /100 | #165 | Average 11.7% |
Demographics Similar to Immigrants from Western Asia by Disability
In terms of disability, the demographic groups most similar to Immigrants from Western Asia are Immigrants from Brazil (11.2%, a difference of 0.020%), Ecuadorian (11.2%, a difference of 0.040%), Immigrants from Ecuador (11.2%, a difference of 0.040%), Immigrants from South Africa (11.2%, a difference of 0.070%), and Immigrants from Morocco (11.2%, a difference of 0.16%).
| Demographics | Rating | Rank | Disability |
| Immigrants | Sierra Leone | 99.0 /100 | #84 | Exceptional 11.1% |
| Immigrants | Belarus | 98.9 /100 | #85 | Exceptional 11.1% |
| Immigrants | Russia | 98.9 /100 | #86 | Exceptional 11.1% |
| Palestinians | 98.9 /100 | #87 | Exceptional 11.1% |
| Immigrants | Romania | 98.5 /100 | #88 | Exceptional 11.2% |
| Immigrants | South Africa | 98.2 /100 | #89 | Exceptional 11.2% |
| Immigrants | Brazil | 98.1 /100 | #90 | Exceptional 11.2% |
| Immigrants | Western Asia | 98.1 /100 | #91 | Exceptional 11.2% |
| Ecuadorians | 98.0 /100 | #92 | Exceptional 11.2% |
| Immigrants | Ecuador | 98.0 /100 | #93 | Exceptional 11.2% |
| Immigrants | Morocco | 97.8 /100 | #94 | Exceptional 11.2% |
| Eastern Europeans | 97.8 /100 | #95 | Exceptional 11.2% |
| Immigrants | Zimbabwe | 97.7 /100 | #96 | Exceptional 11.2% |
| Bhutanese | 97.4 /100 | #97 | Exceptional 11.2% |
| Uruguayans | 97.4 /100 | #98 | Exceptional 11.2% |