Celtic vs Immigrants from South America Female Disability
COMPARE
Celtic
Immigrants from South America
Female Disability
Female Disability Comparison
Celtics
Immigrants from South America
13.3%
FEMALE DISABILITY
0.0/ 100
METRIC RATING
294th/ 347
METRIC RANK
11.4%
FEMALE DISABILITY
99.9/ 100
METRIC RATING
65th/ 347
METRIC RANK
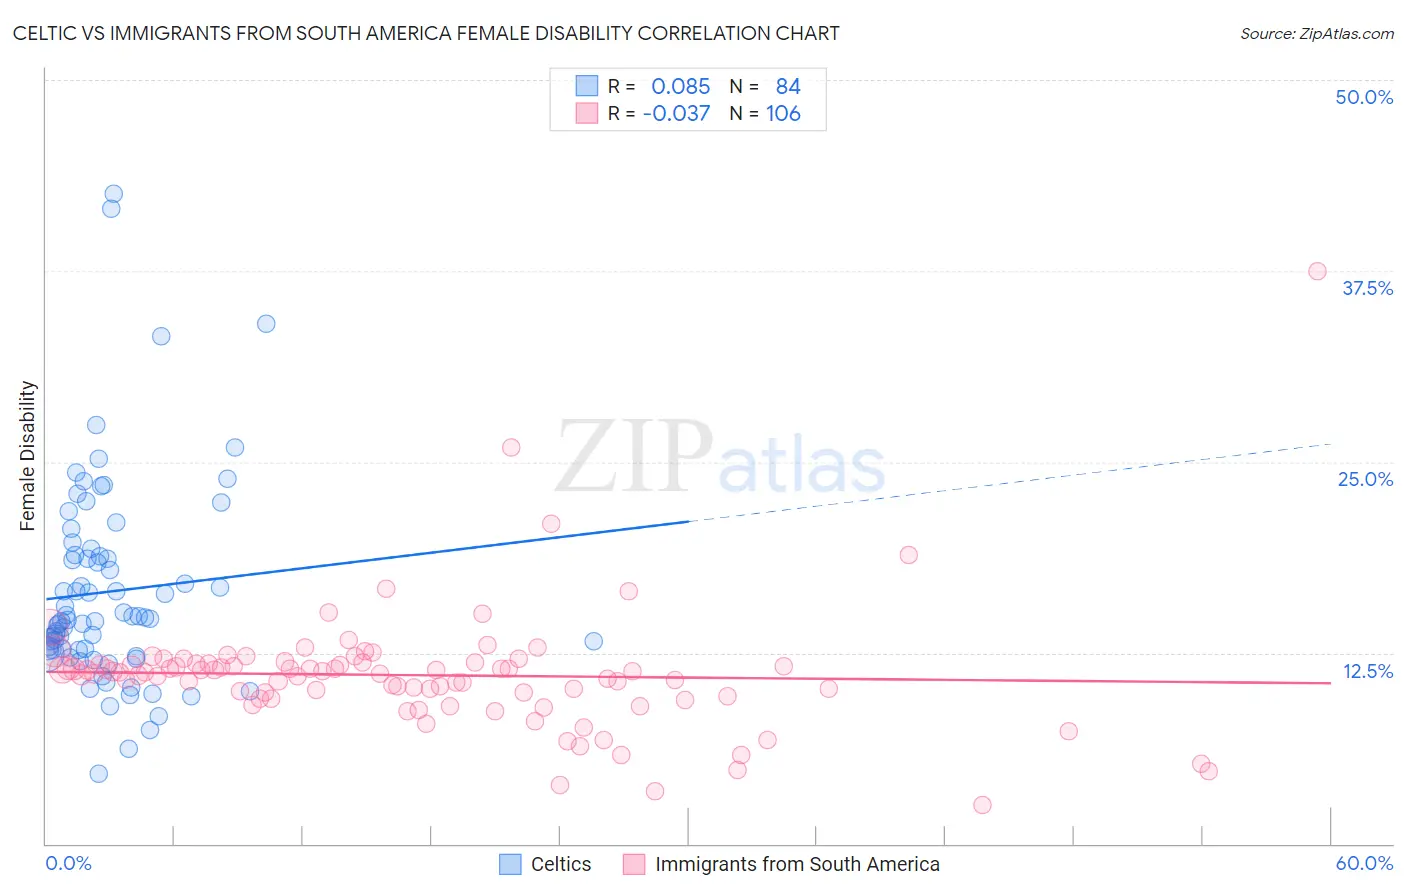
Celtic vs Immigrants from South America Female Disability Correlation Chart
The statistical analysis conducted on geographies consisting of 168,857,089 people shows a slight positive correlation between the proportion of Celtics and percentage of females with a disability in the United States with a correlation coefficient (R) of 0.085 and weighted average of 13.3%. Similarly, the statistical analysis conducted on geographies consisting of 486,308,642 people shows no correlation between the proportion of Immigrants from South America and percentage of females with a disability in the United States with a correlation coefficient (R) of -0.037 and weighted average of 11.4%, a difference of 16.1%.
Female Disability Correlation Summary
| Measurement | Celtic | Immigrants from South America |
| Minimum | 4.6% | 2.5% |
| Maximum | 42.6% | 37.5% |
| Range | 38.0% | 35.0% |
| Mean | 16.5% | 11.0% |
| Median | 14.7% | 11.2% |
| Interquartile 25% (IQ1) | 12.7% | 9.6% |
| Interquartile 75% (IQ3) | 18.9% | 11.8% |
| Interquartile Range (IQR) | 6.2% | 2.2% |
| Standard Deviation (Sample) | 6.8% | 4.1% |
| Standard Deviation (Population) | 6.7% | 4.1% |
Similar Demographics by Female Disability
Demographics Similar to Celtics by Female Disability
In terms of female disability, the demographic groups most similar to Celtics are Marshallese (13.3%, a difference of 0.050%), French (13.3%, a difference of 0.21%), Yakama (13.2%, a difference of 0.31%), Nepalese (13.3%, a difference of 0.34%), and Slovak (13.3%, a difference of 0.38%).
| Demographics | Rating | Rank | Female Disability |
| Yaqui | 0.0 /100 | #287 | Tragic 13.2% |
| Whites/Caucasians | 0.0 /100 | #288 | Tragic 13.2% |
| Tlingit-Haida | 0.0 /100 | #289 | Tragic 13.2% |
| Immigrants | Yemen | 0.0 /100 | #290 | Tragic 13.2% |
| Shoshone | 0.0 /100 | #291 | Tragic 13.2% |
| Yakama | 0.0 /100 | #292 | Tragic 13.2% |
| Marshallese | 0.0 /100 | #293 | Tragic 13.3% |
| Celtics | 0.0 /100 | #294 | Tragic 13.3% |
| French | 0.0 /100 | #295 | Tragic 13.3% |
| Nepalese | 0.0 /100 | #296 | Tragic 13.3% |
| Slovaks | 0.0 /100 | #297 | Tragic 13.3% |
| Immigrants | Nonimmigrants | 0.0 /100 | #298 | Tragic 13.4% |
| Immigrants | Dominican Republic | 0.0 /100 | #299 | Tragic 13.4% |
| Pennsylvania Germans | 0.0 /100 | #300 | Tragic 13.4% |
| Africans | 0.0 /100 | #301 | Tragic 13.4% |
Demographics Similar to Immigrants from South America by Female Disability
In terms of female disability, the demographic groups most similar to Immigrants from South America are Immigrants from El Salvador (11.4%, a difference of 0.020%), Immigrants from Colombia (11.4%, a difference of 0.090%), Salvadoran (11.5%, a difference of 0.17%), Sri Lankan (11.4%, a difference of 0.19%), and Immigrants from Vietnam (11.5%, a difference of 0.22%).
| Demographics | Rating | Rank | Female Disability |
| Laotians | 99.9 /100 | #58 | Exceptional 11.4% |
| Immigrants | Spain | 99.9 /100 | #59 | Exceptional 11.4% |
| Immigrants | Bulgaria | 99.9 /100 | #60 | Exceptional 11.4% |
| Immigrants | France | 99.9 /100 | #61 | Exceptional 11.4% |
| Sri Lankans | 99.9 /100 | #62 | Exceptional 11.4% |
| Immigrants | Colombia | 99.9 /100 | #63 | Exceptional 11.4% |
| Immigrants | El Salvador | 99.9 /100 | #64 | Exceptional 11.4% |
| Immigrants | South America | 99.9 /100 | #65 | Exceptional 11.4% |
| Salvadorans | 99.8 /100 | #66 | Exceptional 11.5% |
| Immigrants | Vietnam | 99.8 /100 | #67 | Exceptional 11.5% |
| Immigrants | Northern Africa | 99.8 /100 | #68 | Exceptional 11.5% |
| Colombians | 99.8 /100 | #69 | Exceptional 11.5% |
| Immigrants | Chile | 99.8 /100 | #70 | Exceptional 11.5% |
| Immigrants | Ireland | 99.8 /100 | #71 | Exceptional 11.5% |
| Chileans | 99.8 /100 | #72 | Exceptional 11.5% |