Celtic vs Immigrants from South America In Labor Force | Age 20-24
COMPARE
Celtic
Immigrants from South America
In Labor Force | Age 20-24
In Labor Force | Age 20-24 Comparison
Celtics
Immigrants from South America
77.1%
IN LABOR FORCE | AGE 20-24
99.9/ 100
METRIC RATING
54th/ 347
METRIC RANK
73.3%
IN LABOR FORCE | AGE 20-24
0.2/ 100
METRIC RATING
275th/ 347
METRIC RANK
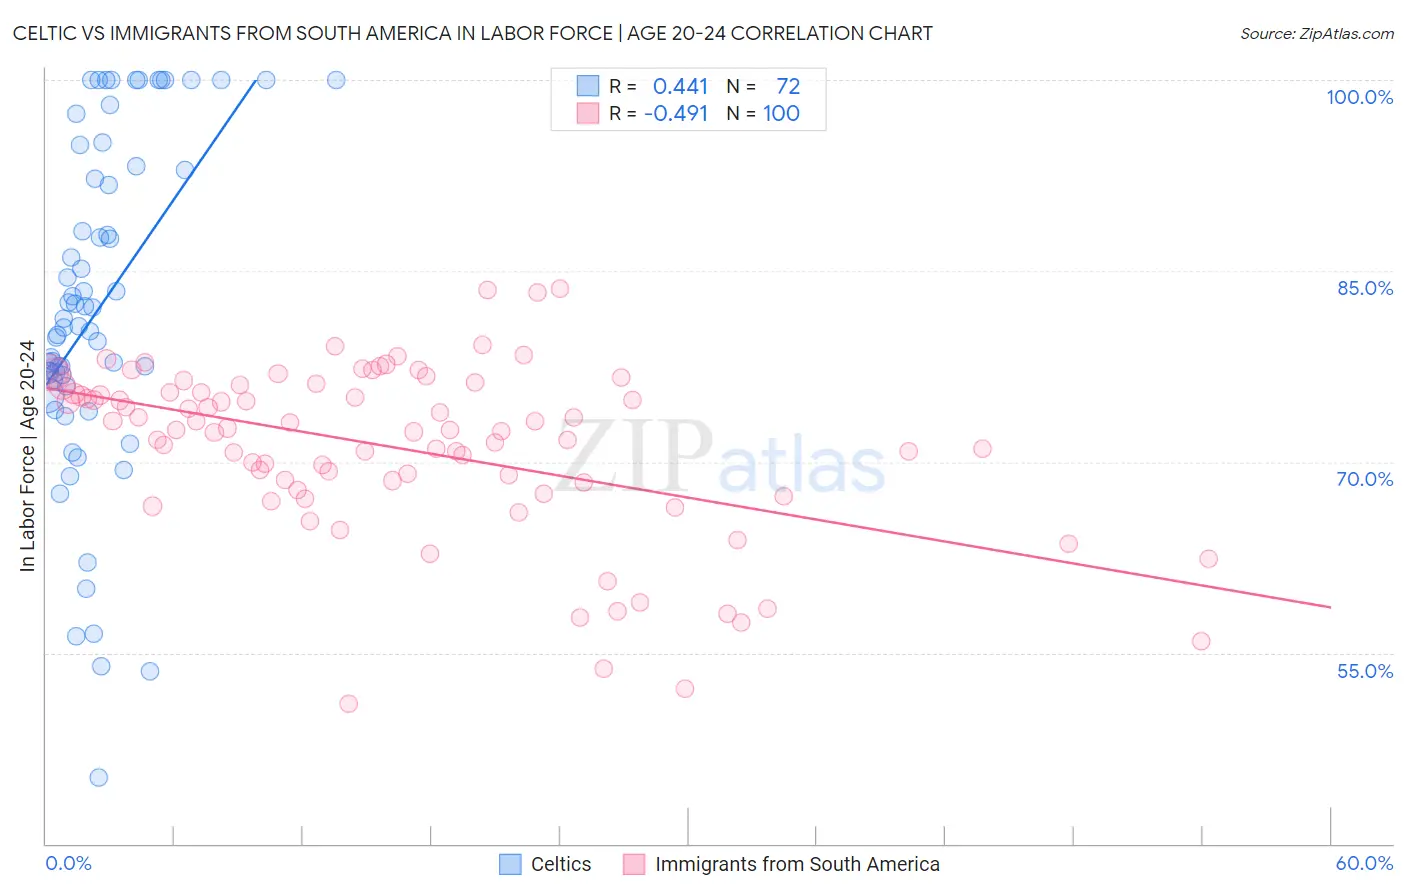
Celtic vs Immigrants from South America In Labor Force | Age 20-24 Correlation Chart
The statistical analysis conducted on geographies consisting of 168,822,890 people shows a moderate positive correlation between the proportion of Celtics and labor force participation rate among population between the ages 20 and 24 in the United States with a correlation coefficient (R) of 0.441 and weighted average of 77.1%. Similarly, the statistical analysis conducted on geographies consisting of 486,128,145 people shows a moderate negative correlation between the proportion of Immigrants from South America and labor force participation rate among population between the ages 20 and 24 in the United States with a correlation coefficient (R) of -0.491 and weighted average of 73.3%, a difference of 5.1%.
In Labor Force | Age 20-24 Correlation Summary
| Measurement | Celtic | Immigrants from South America |
| Minimum | 45.2% | 51.0% |
| Maximum | 100.0% | 83.6% |
| Range | 54.8% | 32.6% |
| Mean | 82.1% | 71.1% |
| Median | 81.0% | 72.5% |
| Interquartile 25% (IQ1) | 76.2% | 68.1% |
| Interquartile 75% (IQ3) | 93.0% | 75.7% |
| Interquartile Range (IQR) | 16.9% | 7.6% |
| Standard Deviation (Sample) | 13.2% | 6.8% |
| Standard Deviation (Population) | 13.1% | 6.7% |
Similar Demographics by In Labor Force | Age 20-24
Demographics Similar to Celtics by In Labor Force | Age 20-24
In terms of in labor force | age 20-24, the demographic groups most similar to Celtics are Immigrants from Liberia (77.1%, a difference of 0.020%), European (77.1%, a difference of 0.030%), Chippewa (77.1%, a difference of 0.040%), Hawaiian (77.0%, a difference of 0.060%), and Scotch-Irish (77.0%, a difference of 0.090%).
| Demographics | Rating | Rank | In Labor Force | Age 20-24 |
| Ethiopians | 100.0 /100 | #47 | Exceptional 77.3% |
| Serbians | 100.0 /100 | #48 | Exceptional 77.3% |
| Chinese | 100.0 /100 | #49 | Exceptional 77.3% |
| Malaysians | 100.0 /100 | #50 | Exceptional 77.2% |
| Croatians | 100.0 /100 | #51 | Exceptional 77.2% |
| Indonesians | 100.0 /100 | #52 | Exceptional 77.2% |
| Immigrants | Azores | 100.0 /100 | #53 | Exceptional 77.2% |
| Celtics | 99.9 /100 | #54 | Exceptional 77.1% |
| Immigrants | Liberia | 99.9 /100 | #55 | Exceptional 77.1% |
| Europeans | 99.9 /100 | #56 | Exceptional 77.1% |
| Chippewa | 99.9 /100 | #57 | Exceptional 77.1% |
| Hawaiians | 99.9 /100 | #58 | Exceptional 77.0% |
| Scotch-Irish | 99.9 /100 | #59 | Exceptional 77.0% |
| Kenyans | 99.9 /100 | #60 | Exceptional 77.0% |
| Immigrants | Eritrea | 99.9 /100 | #61 | Exceptional 77.0% |
Demographics Similar to Immigrants from South America by In Labor Force | Age 20-24
In terms of in labor force | age 20-24, the demographic groups most similar to Immigrants from South America are Mongolian (73.3%, a difference of 0.010%), Immigrants from Malaysia (73.3%, a difference of 0.020%), Cypriot (73.3%, a difference of 0.040%), Immigrants from Colombia (73.4%, a difference of 0.050%), and Venezuelan (73.3%, a difference of 0.050%).
| Demographics | Rating | Rank | In Labor Force | Age 20-24 |
| South Americans | 0.4 /100 | #268 | Tragic 73.5% |
| Colombians | 0.3 /100 | #269 | Tragic 73.5% |
| Immigrants | Russia | 0.3 /100 | #270 | Tragic 73.5% |
| Immigrants | Indonesia | 0.3 /100 | #271 | Tragic 73.4% |
| Belizeans | 0.3 /100 | #272 | Tragic 73.4% |
| Cheyenne | 0.2 /100 | #273 | Tragic 73.4% |
| Immigrants | Colombia | 0.2 /100 | #274 | Tragic 73.4% |
| Immigrants | South America | 0.2 /100 | #275 | Tragic 73.3% |
| Mongolians | 0.2 /100 | #276 | Tragic 73.3% |
| Immigrants | Malaysia | 0.2 /100 | #277 | Tragic 73.3% |
| Cypriots | 0.2 /100 | #278 | Tragic 73.3% |
| Venezuelans | 0.2 /100 | #279 | Tragic 73.3% |
| Bahamians | 0.1 /100 | #280 | Tragic 73.3% |
| Immigrants | Venezuela | 0.1 /100 | #281 | Tragic 73.2% |
| Immigrants | Spain | 0.1 /100 | #282 | Tragic 73.2% |