Nicaraguan vs Immigrants from South America Female Disability
COMPARE
Nicaraguan
Immigrants from South America
Female Disability
Female Disability Comparison
Nicaraguans
Immigrants from South America
11.9%
FEMALE DISABILITY
95.2/ 100
METRIC RATING
130th/ 347
METRIC RANK
11.4%
FEMALE DISABILITY
99.9/ 100
METRIC RATING
65th/ 347
METRIC RANK
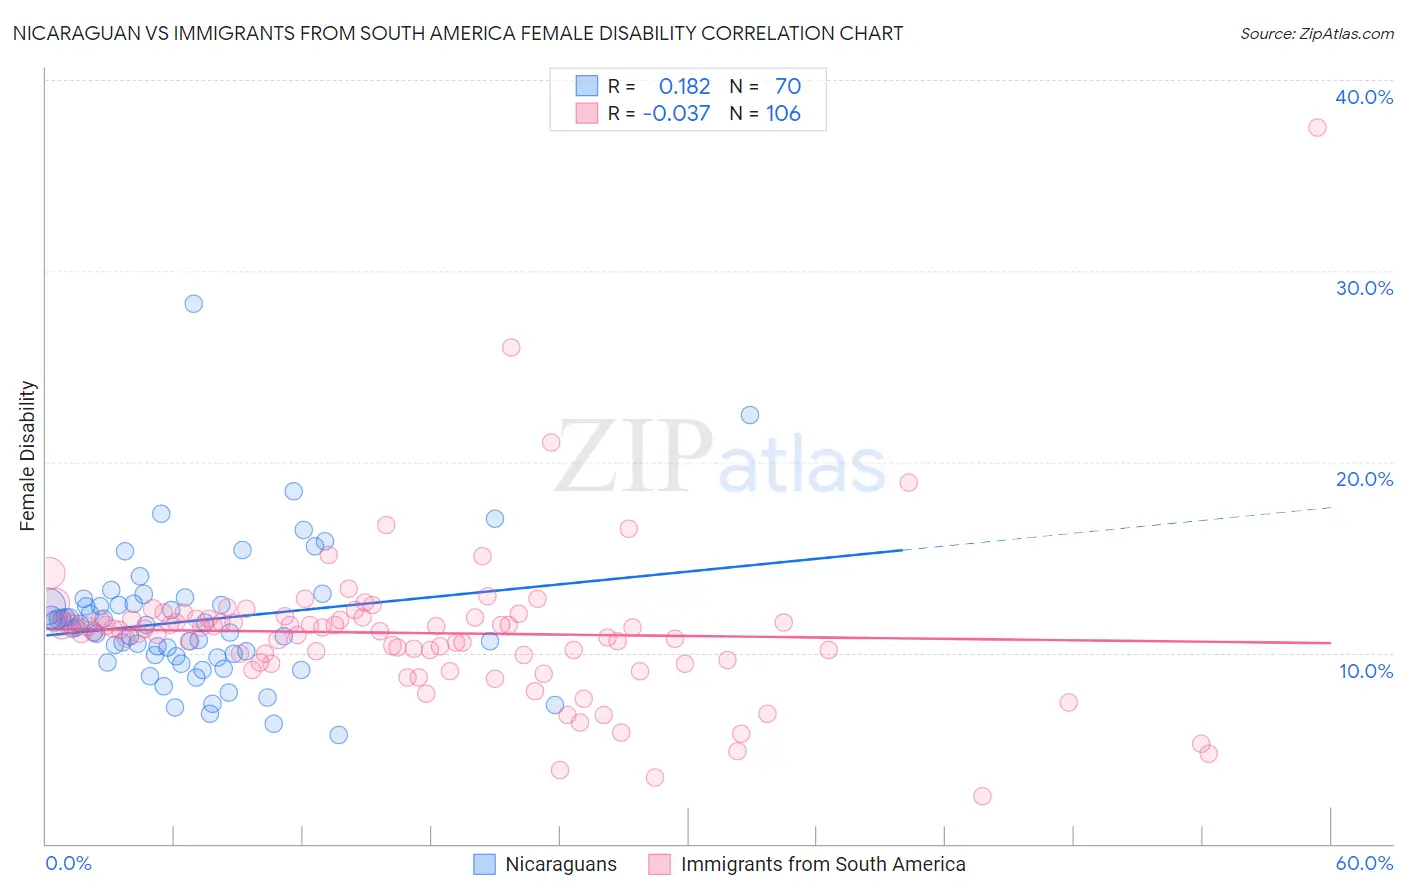
Nicaraguan vs Immigrants from South America Female Disability Correlation Chart
The statistical analysis conducted on geographies consisting of 285,687,392 people shows a poor positive correlation between the proportion of Nicaraguans and percentage of females with a disability in the United States with a correlation coefficient (R) of 0.182 and weighted average of 11.9%. Similarly, the statistical analysis conducted on geographies consisting of 486,308,642 people shows no correlation between the proportion of Immigrants from South America and percentage of females with a disability in the United States with a correlation coefficient (R) of -0.037 and weighted average of 11.4%, a difference of 3.6%.
Female Disability Correlation Summary
| Measurement | Nicaraguan | Immigrants from South America |
| Minimum | 5.7% | 2.5% |
| Maximum | 28.3% | 37.5% |
| Range | 22.6% | 35.0% |
| Mean | 11.7% | 11.0% |
| Median | 11.3% | 11.2% |
| Interquartile 25% (IQ1) | 9.8% | 9.6% |
| Interquartile 75% (IQ3) | 12.5% | 11.8% |
| Interquartile Range (IQR) | 2.7% | 2.2% |
| Standard Deviation (Sample) | 3.5% | 4.1% |
| Standard Deviation (Population) | 3.5% | 4.1% |
Similar Demographics by Female Disability
Demographics Similar to Nicaraguans by Female Disability
In terms of female disability, the demographic groups most similar to Nicaraguans are Arab (11.9%, a difference of 0.030%), Macedonian (11.8%, a difference of 0.060%), Immigrants from Latvia (11.8%, a difference of 0.090%), Immigrants from Syria (11.9%, a difference of 0.12%), and South American Indian (11.8%, a difference of 0.13%).
| Demographics | Rating | Rank | Female Disability |
| Immigrants | Croatia | 96.7 /100 | #123 | Exceptional 11.8% |
| Russians | 96.5 /100 | #124 | Exceptional 11.8% |
| Immigrants | Italy | 96.4 /100 | #125 | Exceptional 11.8% |
| Immigrants | Europe | 96.2 /100 | #126 | Exceptional 11.8% |
| South American Indians | 95.8 /100 | #127 | Exceptional 11.8% |
| Immigrants | Latvia | 95.6 /100 | #128 | Exceptional 11.8% |
| Macedonians | 95.5 /100 | #129 | Exceptional 11.8% |
| Nicaraguans | 95.2 /100 | #130 | Exceptional 11.9% |
| Arabs | 95.1 /100 | #131 | Exceptional 11.9% |
| Immigrants | Syria | 94.6 /100 | #132 | Exceptional 11.9% |
| Kenyans | 94.5 /100 | #133 | Exceptional 11.9% |
| Immigrants | Nicaragua | 94.5 /100 | #134 | Exceptional 11.9% |
| Central Americans | 94.2 /100 | #135 | Exceptional 11.9% |
| Ugandans | 94.0 /100 | #136 | Exceptional 11.9% |
| Immigrants | Norway | 93.8 /100 | #137 | Exceptional 11.9% |
Demographics Similar to Immigrants from South America by Female Disability
In terms of female disability, the demographic groups most similar to Immigrants from South America are Immigrants from El Salvador (11.4%, a difference of 0.020%), Immigrants from Colombia (11.4%, a difference of 0.090%), Salvadoran (11.5%, a difference of 0.17%), Sri Lankan (11.4%, a difference of 0.19%), and Immigrants from Vietnam (11.5%, a difference of 0.22%).
| Demographics | Rating | Rank | Female Disability |
| Laotians | 99.9 /100 | #58 | Exceptional 11.4% |
| Immigrants | Spain | 99.9 /100 | #59 | Exceptional 11.4% |
| Immigrants | Bulgaria | 99.9 /100 | #60 | Exceptional 11.4% |
| Immigrants | France | 99.9 /100 | #61 | Exceptional 11.4% |
| Sri Lankans | 99.9 /100 | #62 | Exceptional 11.4% |
| Immigrants | Colombia | 99.9 /100 | #63 | Exceptional 11.4% |
| Immigrants | El Salvador | 99.9 /100 | #64 | Exceptional 11.4% |
| Immigrants | South America | 99.9 /100 | #65 | Exceptional 11.4% |
| Salvadorans | 99.8 /100 | #66 | Exceptional 11.5% |
| Immigrants | Vietnam | 99.8 /100 | #67 | Exceptional 11.5% |
| Immigrants | Northern Africa | 99.8 /100 | #68 | Exceptional 11.5% |
| Colombians | 99.8 /100 | #69 | Exceptional 11.5% |
| Immigrants | Chile | 99.8 /100 | #70 | Exceptional 11.5% |
| Immigrants | Ireland | 99.8 /100 | #71 | Exceptional 11.5% |
| Chileans | 99.8 /100 | #72 | Exceptional 11.5% |