Celtic vs Immigrants from Guatemala Female Disability
COMPARE
Celtic
Immigrants from Guatemala
Female Disability
Female Disability Comparison
Celtics
Immigrants from Guatemala
13.3%
FEMALE DISABILITY
0.0/ 100
METRIC RATING
294th/ 347
METRIC RANK
12.1%
FEMALE DISABILITY
66.0/ 100
METRIC RATING
160th/ 347
METRIC RANK
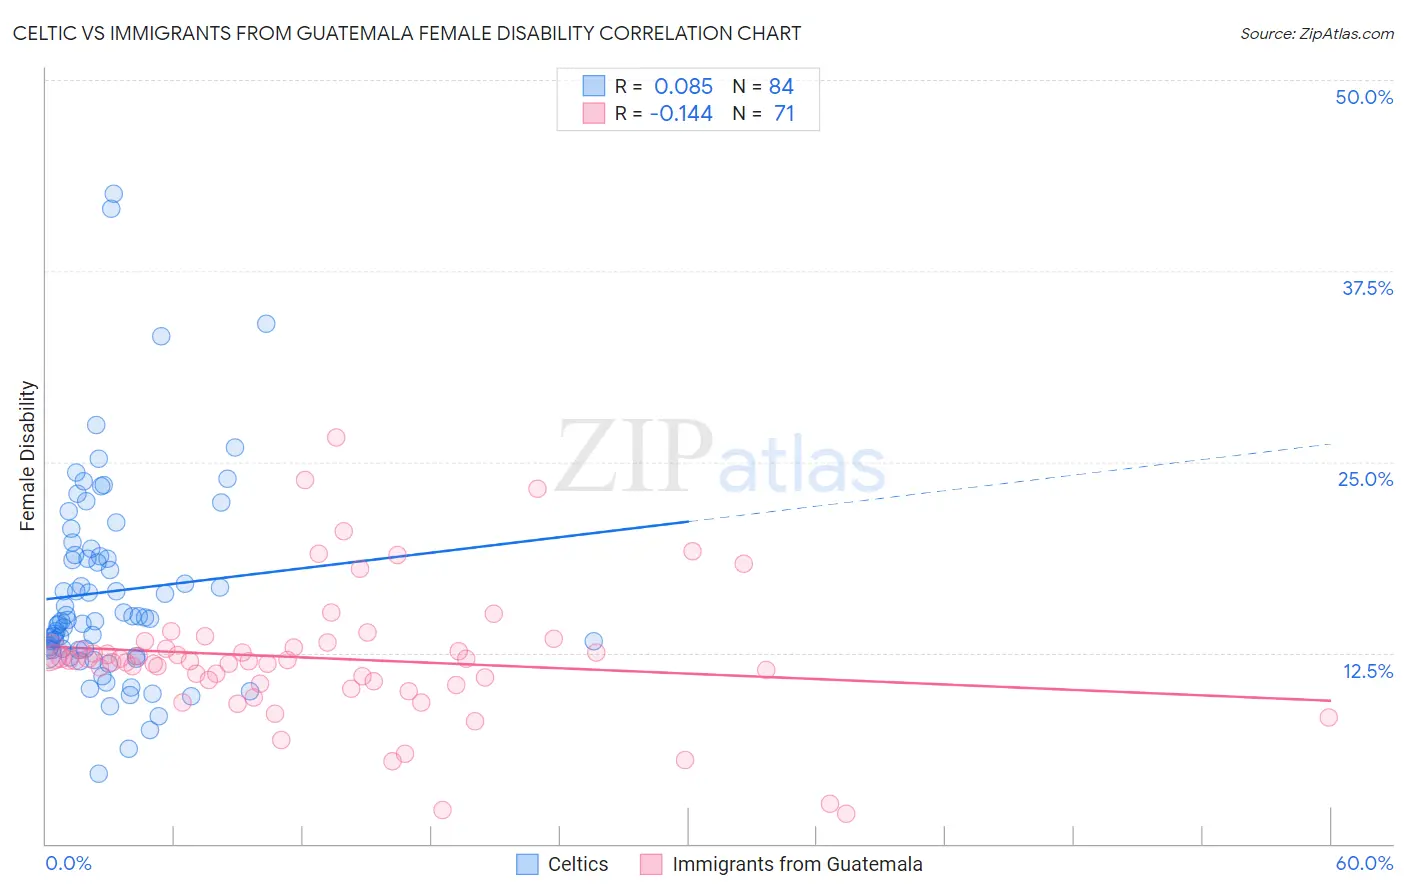
Celtic vs Immigrants from Guatemala Female Disability Correlation Chart
The statistical analysis conducted on geographies consisting of 168,857,089 people shows a slight positive correlation between the proportion of Celtics and percentage of females with a disability in the United States with a correlation coefficient (R) of 0.085 and weighted average of 13.3%. Similarly, the statistical analysis conducted on geographies consisting of 377,228,850 people shows a poor negative correlation between the proportion of Immigrants from Guatemala and percentage of females with a disability in the United States with a correlation coefficient (R) of -0.144 and weighted average of 12.1%, a difference of 9.6%.
Female Disability Correlation Summary
| Measurement | Celtic | Immigrants from Guatemala |
| Minimum | 4.6% | 2.0% |
| Maximum | 42.6% | 26.6% |
| Range | 38.0% | 24.7% |
| Mean | 16.5% | 12.1% |
| Median | 14.7% | 12.0% |
| Interquartile 25% (IQ1) | 12.7% | 10.5% |
| Interquartile 75% (IQ3) | 18.9% | 12.9% |
| Interquartile Range (IQR) | 6.2% | 2.4% |
| Standard Deviation (Sample) | 6.8% | 4.4% |
| Standard Deviation (Population) | 6.7% | 4.3% |
Similar Demographics by Female Disability
Demographics Similar to Celtics by Female Disability
In terms of female disability, the demographic groups most similar to Celtics are Marshallese (13.3%, a difference of 0.050%), French (13.3%, a difference of 0.21%), Yakama (13.2%, a difference of 0.31%), Nepalese (13.3%, a difference of 0.34%), and Slovak (13.3%, a difference of 0.38%).
| Demographics | Rating | Rank | Female Disability |
| Yaqui | 0.0 /100 | #287 | Tragic 13.2% |
| Whites/Caucasians | 0.0 /100 | #288 | Tragic 13.2% |
| Tlingit-Haida | 0.0 /100 | #289 | Tragic 13.2% |
| Immigrants | Yemen | 0.0 /100 | #290 | Tragic 13.2% |
| Shoshone | 0.0 /100 | #291 | Tragic 13.2% |
| Yakama | 0.0 /100 | #292 | Tragic 13.2% |
| Marshallese | 0.0 /100 | #293 | Tragic 13.3% |
| Celtics | 0.0 /100 | #294 | Tragic 13.3% |
| French | 0.0 /100 | #295 | Tragic 13.3% |
| Nepalese | 0.0 /100 | #296 | Tragic 13.3% |
| Slovaks | 0.0 /100 | #297 | Tragic 13.3% |
| Immigrants | Nonimmigrants | 0.0 /100 | #298 | Tragic 13.4% |
| Immigrants | Dominican Republic | 0.0 /100 | #299 | Tragic 13.4% |
| Pennsylvania Germans | 0.0 /100 | #300 | Tragic 13.4% |
| Africans | 0.0 /100 | #301 | Tragic 13.4% |
Demographics Similar to Immigrants from Guatemala by Female Disability
In terms of female disability, the demographic groups most similar to Immigrants from Guatemala are Guyanese (12.1%, a difference of 0.060%), Immigrants from Central America (12.1%, a difference of 0.070%), Immigrants from Ukraine (12.1%, a difference of 0.070%), Guatemalan (12.1%, a difference of 0.090%), and Czech (12.1%, a difference of 0.10%).
| Demographics | Rating | Rank | Female Disability |
| Sudanese | 79.1 /100 | #153 | Good 12.0% |
| Syrians | 76.9 /100 | #154 | Good 12.1% |
| Ghanaians | 76.6 /100 | #155 | Good 12.1% |
| Moroccans | 72.9 /100 | #156 | Good 12.1% |
| Danes | 72.5 /100 | #157 | Good 12.1% |
| Immigrants | Middle Africa | 72.4 /100 | #158 | Good 12.1% |
| Immigrants | Central America | 67.7 /100 | #159 | Good 12.1% |
| Immigrants | Guatemala | 66.0 /100 | #160 | Good 12.1% |
| Guyanese | 64.7 /100 | #161 | Good 12.1% |
| Immigrants | Ukraine | 64.3 /100 | #162 | Good 12.1% |
| Guatemalans | 63.8 /100 | #163 | Good 12.1% |
| Czechs | 63.6 /100 | #164 | Good 12.1% |
| Immigrants | Oceania | 61.8 /100 | #165 | Good 12.1% |
| Lithuanians | 59.5 /100 | #166 | Average 12.2% |
| Immigrants | Latin America | 59.0 /100 | #167 | Average 12.2% |