Celtic vs Immigrants from South America Currently Married
COMPARE
Celtic
Immigrants from South America
Currently Married
Currently Married Comparison
Celtics
Immigrants from South America
47.8%
CURRENTLY MARRIED
94.2/ 100
METRIC RATING
100th/ 347
METRIC RANK
45.7%
CURRENTLY MARRIED
10.8/ 100
METRIC RATING
207th/ 347
METRIC RANK
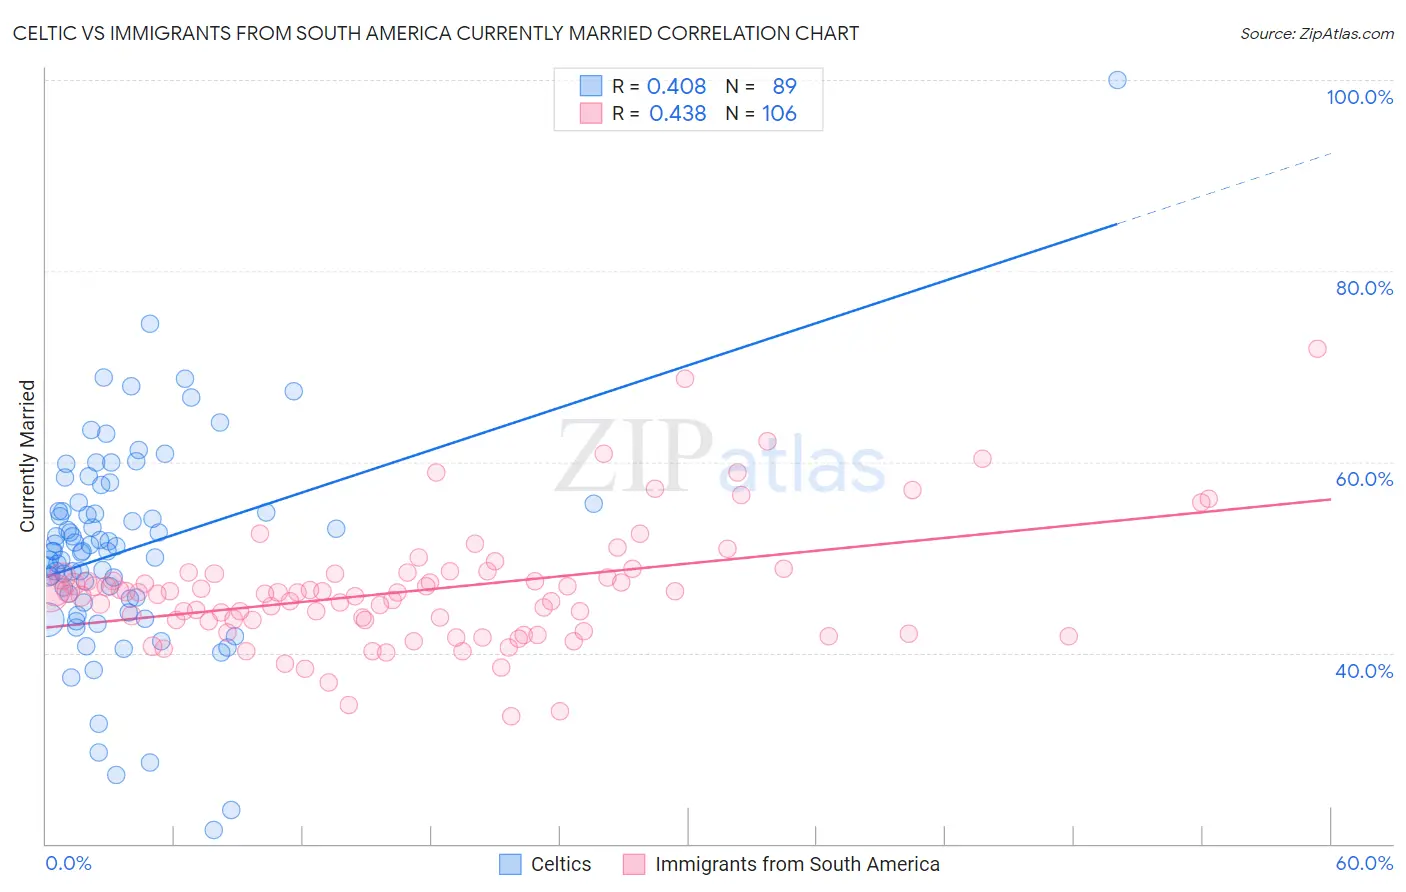
Celtic vs Immigrants from South America Currently Married Correlation Chart
The statistical analysis conducted on geographies consisting of 168,877,326 people shows a moderate positive correlation between the proportion of Celtics and percentage of population currently married in the United States with a correlation coefficient (R) of 0.408 and weighted average of 47.8%. Similarly, the statistical analysis conducted on geographies consisting of 486,361,884 people shows a moderate positive correlation between the proportion of Immigrants from South America and percentage of population currently married in the United States with a correlation coefficient (R) of 0.438 and weighted average of 45.7%, a difference of 4.5%.
Currently Married Correlation Summary
| Measurement | Celtic | Immigrants from South America |
| Minimum | 21.4% | 33.3% |
| Maximum | 100.0% | 71.9% |
| Range | 78.6% | 38.6% |
| Mean | 50.8% | 46.5% |
| Median | 50.7% | 46.2% |
| Interquartile 25% (IQ1) | 45.4% | 43.3% |
| Interquartile 75% (IQ3) | 55.2% | 48.3% |
| Interquartile Range (IQR) | 9.8% | 4.9% |
| Standard Deviation (Sample) | 11.1% | 6.3% |
| Standard Deviation (Population) | 11.0% | 6.3% |
Similar Demographics by Currently Married
Demographics Similar to Celtics by Currently Married
In terms of currently married, the demographic groups most similar to Celtics are Immigrants from Sweden (47.8%, a difference of 0.020%), Immigrants from Germany (47.8%, a difference of 0.020%), Turkish (47.8%, a difference of 0.040%), Cypriot (47.8%, a difference of 0.070%), and Serbian (47.8%, a difference of 0.080%).
| Demographics | Rating | Rank | Currently Married |
| Lebanese | 95.1 /100 | #93 | Exceptional 47.9% |
| Native Hawaiians | 95.0 /100 | #94 | Exceptional 47.9% |
| Immigrants | Bulgaria | 94.8 /100 | #95 | Exceptional 47.9% |
| Egyptians | 94.8 /100 | #96 | Exceptional 47.9% |
| Immigrants | Ukraine | 94.8 /100 | #97 | Exceptional 47.9% |
| Immigrants | China | 94.7 /100 | #98 | Exceptional 47.9% |
| Immigrants | Sweden | 94.3 /100 | #99 | Exceptional 47.8% |
| Celtics | 94.2 /100 | #100 | Exceptional 47.8% |
| Immigrants | Germany | 94.1 /100 | #101 | Exceptional 47.8% |
| Turks | 93.9 /100 | #102 | Exceptional 47.8% |
| Cypriots | 93.7 /100 | #103 | Exceptional 47.8% |
| Serbians | 93.6 /100 | #104 | Exceptional 47.8% |
| Immigrants | Singapore | 93.3 /100 | #105 | Exceptional 47.8% |
| Immigrants | Greece | 93.1 /100 | #106 | Exceptional 47.7% |
| Immigrants | Italy | 92.9 /100 | #107 | Exceptional 47.7% |
Demographics Similar to Immigrants from South America by Currently Married
In terms of currently married, the demographic groups most similar to Immigrants from South America are Alsatian (45.7%, a difference of 0.010%), Immigrants (45.8%, a difference of 0.040%), South American Indian (45.8%, a difference of 0.060%), Taiwanese (45.8%, a difference of 0.080%), and Immigrants from Spain (45.8%, a difference of 0.080%).
| Demographics | Rating | Rank | Currently Married |
| Creek | 17.2 /100 | #200 | Poor 46.0% |
| Malaysians | 15.3 /100 | #201 | Poor 45.9% |
| Immigrants | Albania | 14.5 /100 | #202 | Poor 45.9% |
| Taiwanese | 11.7 /100 | #203 | Poor 45.8% |
| Immigrants | Spain | 11.6 /100 | #204 | Poor 45.8% |
| South American Indians | 11.5 /100 | #205 | Poor 45.8% |
| Immigrants | Immigrants | 11.2 /100 | #206 | Poor 45.8% |
| Immigrants | South America | 10.8 /100 | #207 | Poor 45.7% |
| Alsatians | 10.8 /100 | #208 | Poor 45.7% |
| Immigrants | Micronesia | 8.8 /100 | #209 | Tragic 45.6% |
| Uruguayans | 7.9 /100 | #210 | Tragic 45.6% |
| Houma | 7.2 /100 | #211 | Tragic 45.5% |
| Marshallese | 7.2 /100 | #212 | Tragic 45.5% |
| Alaska Natives | 7.0 /100 | #213 | Tragic 45.5% |
| Dutch West Indians | 6.7 /100 | #214 | Tragic 45.5% |