Celtic vs Immigrants from South America No Schooling Completed
COMPARE
Celtic
Immigrants from South America
No Schooling Completed
No Schooling Completed Comparison
Celtics
Immigrants from South America
1.6%
NO SCHOOLING COMPLETED
99.9/ 100
METRIC RATING
50th/ 347
METRIC RANK
2.5%
NO SCHOOLING COMPLETED
0.6/ 100
METRIC RATING
257th/ 347
METRIC RANK
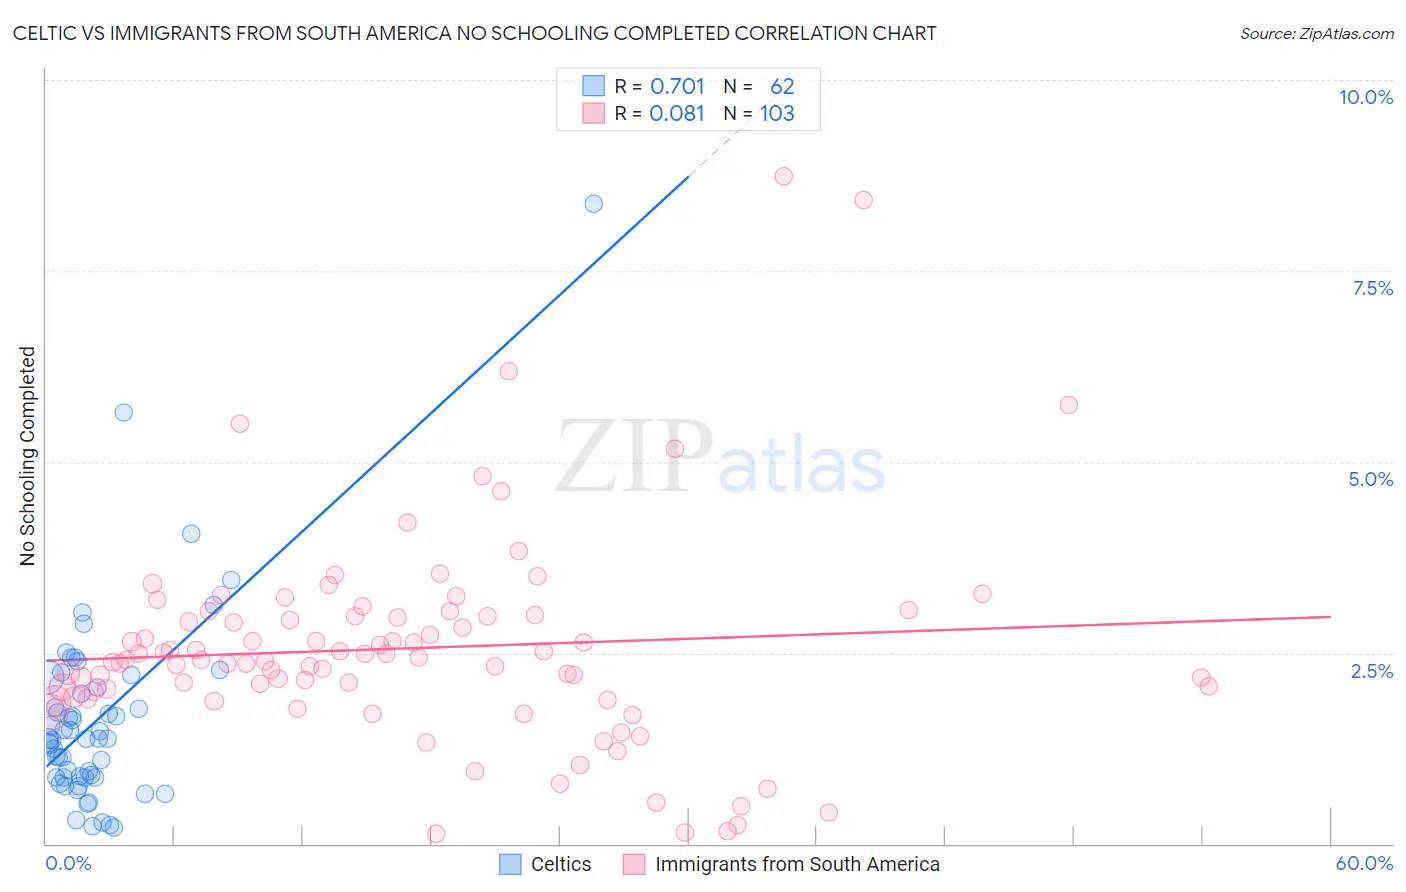
Celtic vs Immigrants from South America No Schooling Completed Correlation Chart
The statistical analysis conducted on geographies consisting of 167,819,688 people shows a strong positive correlation between the proportion of Celtics and percentage of population with no schooling in the United States with a correlation coefficient (R) of 0.701 and weighted average of 1.6%. Similarly, the statistical analysis conducted on geographies consisting of 479,047,016 people shows a slight positive correlation between the proportion of Immigrants from South America and percentage of population with no schooling in the United States with a correlation coefficient (R) of 0.081 and weighted average of 2.5%, a difference of 50.2%.
No Schooling Completed Correlation Summary
| Measurement | Celtic | Immigrants from South America |
| Minimum | 0.22% | 0.14% |
| Maximum | 8.4% | 8.7% |
| Range | 8.2% | 8.6% |
| Mean | 1.6% | 2.6% |
| Median | 1.4% | 2.4% |
| Interquartile 25% (IQ1) | 0.87% | 1.9% |
| Interquartile 75% (IQ3) | 2.0% | 3.0% |
| Interquartile Range (IQR) | 1.2% | 1.1% |
| Standard Deviation (Sample) | 1.3% | 1.4% |
| Standard Deviation (Population) | 1.3% | 1.4% |
Similar Demographics by No Schooling Completed
Demographics Similar to Celtics by No Schooling Completed
In terms of no schooling completed, the demographic groups most similar to Celtics are White/Caucasian (1.6%, a difference of 0.13%), Immigrants from Scotland (1.6%, a difference of 0.19%), Chippewa (1.6%, a difference of 0.20%), Immigrants from Canada (1.6%, a difference of 0.27%), and Creek (1.6%, a difference of 0.40%).
| Demographics | Rating | Rank | No Schooling Completed |
| Australians | 99.9 /100 | #43 | Exceptional 1.6% |
| Estonians | 99.9 /100 | #44 | Exceptional 1.6% |
| Czechoslovakians | 99.9 /100 | #45 | Exceptional 1.6% |
| Maltese | 99.9 /100 | #46 | Exceptional 1.6% |
| Ottawa | 99.9 /100 | #47 | Exceptional 1.6% |
| Immigrants | Scotland | 99.9 /100 | #48 | Exceptional 1.6% |
| Whites/Caucasians | 99.9 /100 | #49 | Exceptional 1.6% |
| Celtics | 99.9 /100 | #50 | Exceptional 1.6% |
| Chippewa | 99.8 /100 | #51 | Exceptional 1.6% |
| Immigrants | Canada | 99.8 /100 | #52 | Exceptional 1.6% |
| Creek | 99.8 /100 | #53 | Exceptional 1.6% |
| Crow | 99.8 /100 | #54 | Exceptional 1.6% |
| Greeks | 99.8 /100 | #55 | Exceptional 1.6% |
| Immigrants | North America | 99.8 /100 | #56 | Exceptional 1.6% |
| Austrians | 99.8 /100 | #57 | Exceptional 1.6% |
Demographics Similar to Immigrants from South America by No Schooling Completed
In terms of no schooling completed, the demographic groups most similar to Immigrants from South America are Assyrian/Chaldean/Syriac (2.5%, a difference of 0.030%), Immigrants from Jamaica (2.5%, a difference of 0.090%), Immigrants from Ethiopia (2.5%, a difference of 0.14%), Armenian (2.5%, a difference of 0.26%), and Immigrants from Sierra Leone (2.5%, a difference of 0.61%).
| Demographics | Rating | Rank | No Schooling Completed |
| Immigrants | Middle Africa | 1.1 /100 | #250 | Tragic 2.4% |
| Immigrants | Africa | 1.1 /100 | #251 | Tragic 2.4% |
| Immigrants | Colombia | 1.0 /100 | #252 | Tragic 2.4% |
| Immigrants | Asia | 0.9 /100 | #253 | Tragic 2.4% |
| Immigrants | Eastern Africa | 0.9 /100 | #254 | Tragic 2.4% |
| Ethiopians | 0.8 /100 | #255 | Tragic 2.4% |
| Yaqui | 0.8 /100 | #256 | Tragic 2.4% |
| Immigrants | South America | 0.6 /100 | #257 | Tragic 2.5% |
| Assyrians/Chaldeans/Syriacs | 0.6 /100 | #258 | Tragic 2.5% |
| Immigrants | Jamaica | 0.6 /100 | #259 | Tragic 2.5% |
| Immigrants | Ethiopia | 0.6 /100 | #260 | Tragic 2.5% |
| Armenians | 0.5 /100 | #261 | Tragic 2.5% |
| Immigrants | Sierra Leone | 0.5 /100 | #262 | Tragic 2.5% |
| Immigrants | Liberia | 0.4 /100 | #263 | Tragic 2.5% |
| Indians (Asian) | 0.4 /100 | #264 | Tragic 2.5% |