Celtic vs Native/Alaskan Female Disability
COMPARE
Celtic
Native/Alaskan
Female Disability
Female Disability Comparison
Celtics
Natives/Alaskans
13.3%
FEMALE DISABILITY
0.0/ 100
METRIC RATING
294th/ 347
METRIC RANK
14.1%
FEMALE DISABILITY
0.0/ 100
METRIC RATING
324th/ 347
METRIC RANK
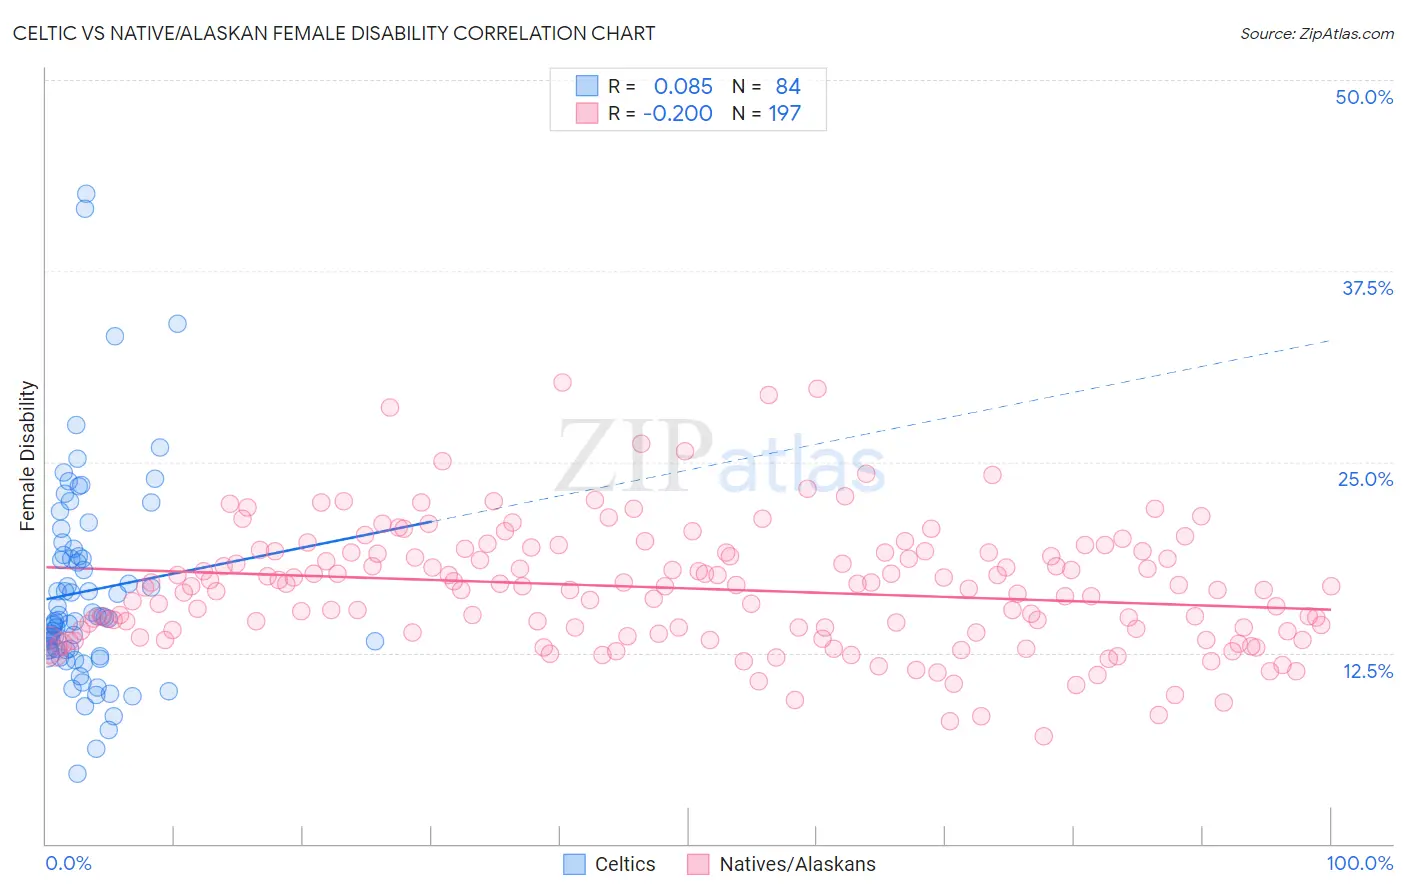
Celtic vs Native/Alaskan Female Disability Correlation Chart
The statistical analysis conducted on geographies consisting of 168,857,089 people shows a slight positive correlation between the proportion of Celtics and percentage of females with a disability in the United States with a correlation coefficient (R) of 0.085 and weighted average of 13.3%. Similarly, the statistical analysis conducted on geographies consisting of 512,836,768 people shows a weak negative correlation between the proportion of Natives/Alaskans and percentage of females with a disability in the United States with a correlation coefficient (R) of -0.200 and weighted average of 14.1%, a difference of 6.5%.
Female Disability Correlation Summary
| Measurement | Celtic | Native/Alaskan |
| Minimum | 4.6% | 7.0% |
| Maximum | 42.6% | 30.2% |
| Range | 38.0% | 23.2% |
| Mean | 16.5% | 16.7% |
| Median | 14.7% | 16.8% |
| Interquartile 25% (IQ1) | 12.7% | 13.9% |
| Interquartile 75% (IQ3) | 18.9% | 19.1% |
| Interquartile Range (IQR) | 6.2% | 5.2% |
| Standard Deviation (Sample) | 6.8% | 4.0% |
| Standard Deviation (Population) | 6.7% | 4.0% |
Similar Demographics by Female Disability
Demographics Similar to Celtics by Female Disability
In terms of female disability, the demographic groups most similar to Celtics are Marshallese (13.3%, a difference of 0.050%), French (13.3%, a difference of 0.21%), Yakama (13.2%, a difference of 0.31%), Nepalese (13.3%, a difference of 0.34%), and Slovak (13.3%, a difference of 0.38%).
| Demographics | Rating | Rank | Female Disability |
| Yaqui | 0.0 /100 | #287 | Tragic 13.2% |
| Whites/Caucasians | 0.0 /100 | #288 | Tragic 13.2% |
| Tlingit-Haida | 0.0 /100 | #289 | Tragic 13.2% |
| Immigrants | Yemen | 0.0 /100 | #290 | Tragic 13.2% |
| Shoshone | 0.0 /100 | #291 | Tragic 13.2% |
| Yakama | 0.0 /100 | #292 | Tragic 13.2% |
| Marshallese | 0.0 /100 | #293 | Tragic 13.3% |
| Celtics | 0.0 /100 | #294 | Tragic 13.3% |
| French | 0.0 /100 | #295 | Tragic 13.3% |
| Nepalese | 0.0 /100 | #296 | Tragic 13.3% |
| Slovaks | 0.0 /100 | #297 | Tragic 13.3% |
| Immigrants | Nonimmigrants | 0.0 /100 | #298 | Tragic 13.4% |
| Immigrants | Dominican Republic | 0.0 /100 | #299 | Tragic 13.4% |
| Pennsylvania Germans | 0.0 /100 | #300 | Tragic 13.4% |
| Africans | 0.0 /100 | #301 | Tragic 13.4% |
Demographics Similar to Natives/Alaskans by Female Disability
In terms of female disability, the demographic groups most similar to Natives/Alaskans are Black/African American (14.1%, a difference of 0.020%), Navajo (14.2%, a difference of 0.14%), Pueblo (14.1%, a difference of 0.18%), Potawatomi (14.1%, a difference of 0.20%), and Comanche (14.2%, a difference of 0.25%).
| Demographics | Rating | Rank | Female Disability |
| Chippewa | 0.0 /100 | #317 | Tragic 14.0% |
| Paiute | 0.0 /100 | #318 | Tragic 14.0% |
| Iroquois | 0.0 /100 | #319 | Tragic 14.0% |
| Americans | 0.0 /100 | #320 | Tragic 14.1% |
| Potawatomi | 0.0 /100 | #321 | Tragic 14.1% |
| Pueblo | 0.0 /100 | #322 | Tragic 14.1% |
| Blacks/African Americans | 0.0 /100 | #323 | Tragic 14.1% |
| Natives/Alaskans | 0.0 /100 | #324 | Tragic 14.1% |
| Navajo | 0.0 /100 | #325 | Tragic 14.2% |
| Comanche | 0.0 /100 | #326 | Tragic 14.2% |
| Ottawa | 0.0 /100 | #327 | Tragic 14.2% |
| Cape Verdeans | 0.0 /100 | #328 | Tragic 14.2% |
| Osage | 0.0 /100 | #329 | Tragic 14.3% |
| Yuman | 0.0 /100 | #330 | Tragic 14.5% |
| Immigrants | Cabo Verde | 0.0 /100 | #331 | Tragic 14.6% |