Celtic vs Somali Female Disability
COMPARE
Celtic
Somali
Female Disability
Female Disability Comparison
Celtics
Somalis
13.3%
FEMALE DISABILITY
0.0/ 100
METRIC RATING
294th/ 347
METRIC RANK
12.3%
FEMALE DISABILITY
21.5/ 100
METRIC RATING
202nd/ 347
METRIC RANK
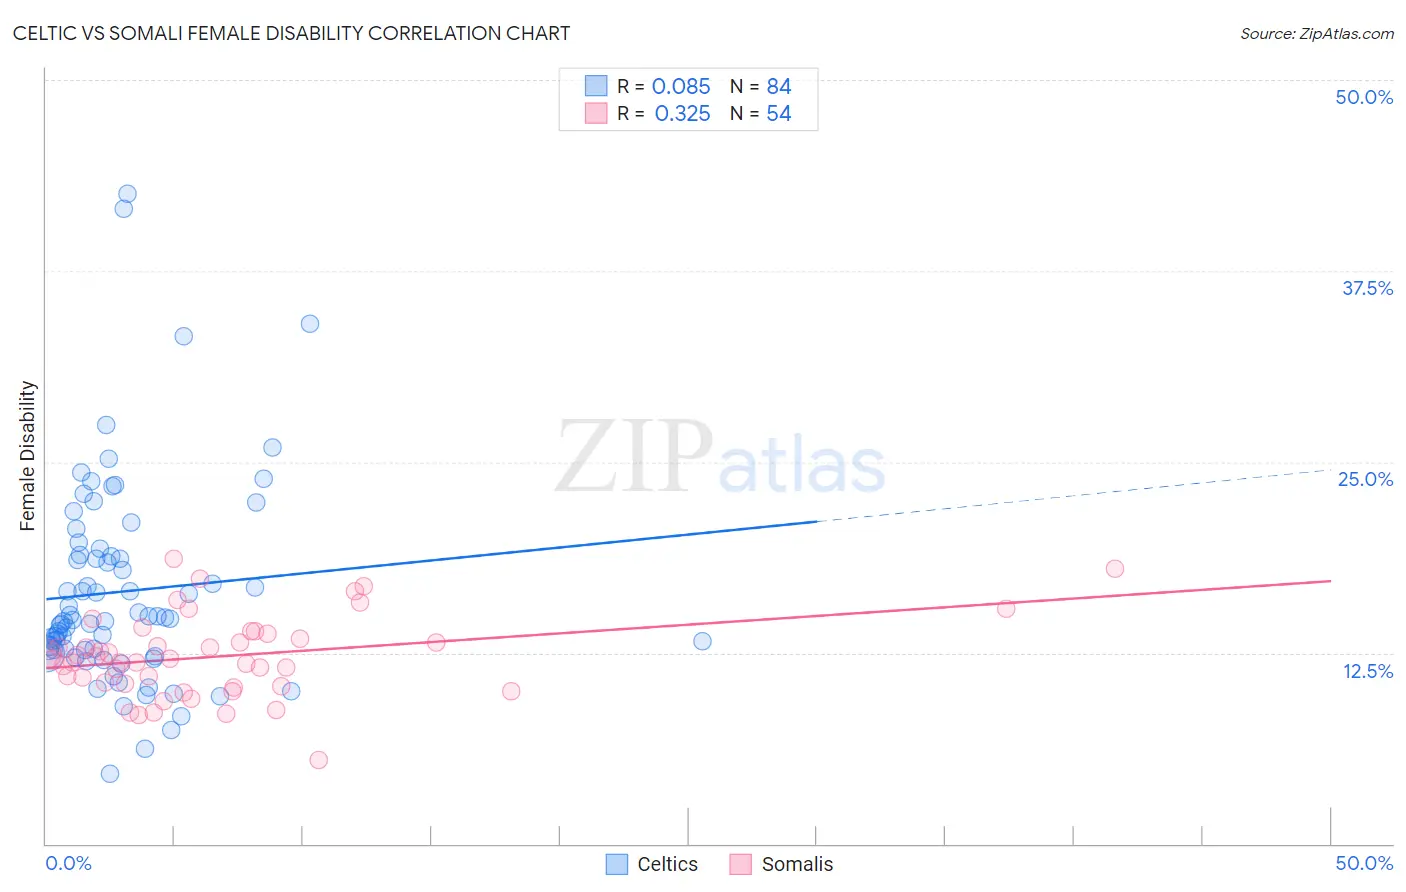
Celtic vs Somali Female Disability Correlation Chart
The statistical analysis conducted on geographies consisting of 168,857,089 people shows a slight positive correlation between the proportion of Celtics and percentage of females with a disability in the United States with a correlation coefficient (R) of 0.085 and weighted average of 13.3%. Similarly, the statistical analysis conducted on geographies consisting of 99,314,959 people shows a mild positive correlation between the proportion of Somalis and percentage of females with a disability in the United States with a correlation coefficient (R) of 0.325 and weighted average of 12.3%, a difference of 7.6%.
Female Disability Correlation Summary
| Measurement | Celtic | Somali |
| Minimum | 4.6% | 5.5% |
| Maximum | 42.6% | 18.6% |
| Range | 38.0% | 13.1% |
| Mean | 16.5% | 12.3% |
| Median | 14.7% | 12.1% |
| Interquartile 25% (IQ1) | 12.7% | 10.5% |
| Interquartile 75% (IQ3) | 18.9% | 13.7% |
| Interquartile Range (IQR) | 6.2% | 3.3% |
| Standard Deviation (Sample) | 6.8% | 2.7% |
| Standard Deviation (Population) | 6.7% | 2.6% |
Similar Demographics by Female Disability
Demographics Similar to Celtics by Female Disability
In terms of female disability, the demographic groups most similar to Celtics are Marshallese (13.3%, a difference of 0.050%), French (13.3%, a difference of 0.21%), Yakama (13.2%, a difference of 0.31%), Nepalese (13.3%, a difference of 0.34%), and Slovak (13.3%, a difference of 0.38%).
| Demographics | Rating | Rank | Female Disability |
| Yaqui | 0.0 /100 | #287 | Tragic 13.2% |
| Whites/Caucasians | 0.0 /100 | #288 | Tragic 13.2% |
| Tlingit-Haida | 0.0 /100 | #289 | Tragic 13.2% |
| Immigrants | Yemen | 0.0 /100 | #290 | Tragic 13.2% |
| Shoshone | 0.0 /100 | #291 | Tragic 13.2% |
| Yakama | 0.0 /100 | #292 | Tragic 13.2% |
| Marshallese | 0.0 /100 | #293 | Tragic 13.3% |
| Celtics | 0.0 /100 | #294 | Tragic 13.3% |
| French | 0.0 /100 | #295 | Tragic 13.3% |
| Nepalese | 0.0 /100 | #296 | Tragic 13.3% |
| Slovaks | 0.0 /100 | #297 | Tragic 13.3% |
| Immigrants | Nonimmigrants | 0.0 /100 | #298 | Tragic 13.4% |
| Immigrants | Dominican Republic | 0.0 /100 | #299 | Tragic 13.4% |
| Pennsylvania Germans | 0.0 /100 | #300 | Tragic 13.4% |
| Africans | 0.0 /100 | #301 | Tragic 13.4% |
Demographics Similar to Somalis by Female Disability
In terms of female disability, the demographic groups most similar to Somalis are Immigrants from Barbados (12.3%, a difference of 0.020%), Chinese (12.3%, a difference of 0.030%), Trinidadian and Tobagonian (12.3%, a difference of 0.040%), Immigrants from Zaire (12.3%, a difference of 0.040%), and Immigrants from Grenada (12.4%, a difference of 0.060%).
| Demographics | Rating | Rank | Female Disability |
| Swedes | 26.6 /100 | #195 | Fair 12.3% |
| Immigrants | Panama | 25.5 /100 | #196 | Fair 12.3% |
| Hondurans | 25.4 /100 | #197 | Fair 12.3% |
| Mexican American Indians | 24.9 /100 | #198 | Fair 12.3% |
| Immigrants | Trinidad and Tobago | 24.7 /100 | #199 | Fair 12.3% |
| Trinidadians and Tobagonians | 22.4 /100 | #200 | Fair 12.3% |
| Chinese | 22.1 /100 | #201 | Fair 12.3% |
| Somalis | 21.5 /100 | #202 | Fair 12.3% |
| Immigrants | Barbados | 21.1 /100 | #203 | Fair 12.3% |
| Immigrants | Zaire | 20.9 /100 | #204 | Fair 12.3% |
| Immigrants | Grenada | 20.5 /100 | #205 | Fair 12.4% |
| Immigrants | Cuba | 20.2 /100 | #206 | Fair 12.4% |
| Croatians | 20.2 /100 | #207 | Fair 12.4% |
| Basques | 17.5 /100 | #208 | Poor 12.4% |
| Mexicans | 15.7 /100 | #209 | Poor 12.4% |