Celtic vs Arab Female Disability
COMPARE
Celtic
Arab
Female Disability
Female Disability Comparison
Celtics
Arabs
13.3%
FEMALE DISABILITY
0.0/ 100
METRIC RATING
294th/ 347
METRIC RANK
11.9%
FEMALE DISABILITY
95.1/ 100
METRIC RATING
131st/ 347
METRIC RANK
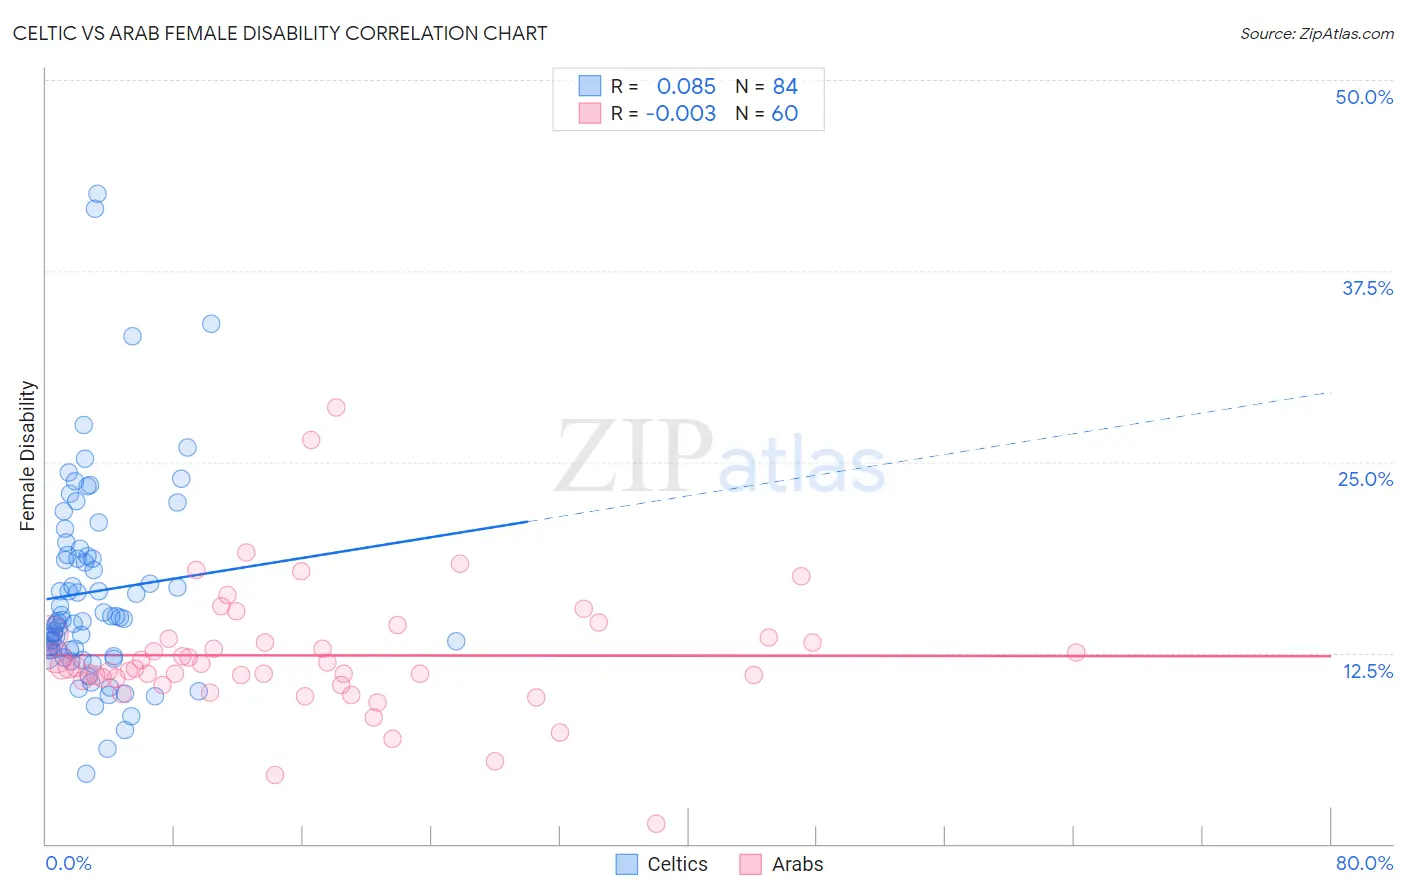
Celtic vs Arab Female Disability Correlation Chart
The statistical analysis conducted on geographies consisting of 168,857,089 people shows a slight positive correlation between the proportion of Celtics and percentage of females with a disability in the United States with a correlation coefficient (R) of 0.085 and weighted average of 13.3%. Similarly, the statistical analysis conducted on geographies consisting of 486,755,725 people shows no correlation between the proportion of Arabs and percentage of females with a disability in the United States with a correlation coefficient (R) of -0.003 and weighted average of 11.9%, a difference of 12.0%.
Female Disability Correlation Summary
| Measurement | Celtic | Arab |
| Minimum | 4.6% | 1.3% |
| Maximum | 42.6% | 28.6% |
| Range | 38.0% | 27.3% |
| Mean | 16.5% | 12.3% |
| Median | 14.7% | 11.5% |
| Interquartile 25% (IQ1) | 12.7% | 10.8% |
| Interquartile 75% (IQ3) | 18.9% | 13.4% |
| Interquartile Range (IQR) | 6.2% | 2.7% |
| Standard Deviation (Sample) | 6.8% | 4.3% |
| Standard Deviation (Population) | 6.7% | 4.2% |
Similar Demographics by Female Disability
Demographics Similar to Celtics by Female Disability
In terms of female disability, the demographic groups most similar to Celtics are Marshallese (13.3%, a difference of 0.050%), French (13.3%, a difference of 0.21%), Yakama (13.2%, a difference of 0.31%), Nepalese (13.3%, a difference of 0.34%), and Slovak (13.3%, a difference of 0.38%).
| Demographics | Rating | Rank | Female Disability |
| Yaqui | 0.0 /100 | #287 | Tragic 13.2% |
| Whites/Caucasians | 0.0 /100 | #288 | Tragic 13.2% |
| Tlingit-Haida | 0.0 /100 | #289 | Tragic 13.2% |
| Immigrants | Yemen | 0.0 /100 | #290 | Tragic 13.2% |
| Shoshone | 0.0 /100 | #291 | Tragic 13.2% |
| Yakama | 0.0 /100 | #292 | Tragic 13.2% |
| Marshallese | 0.0 /100 | #293 | Tragic 13.3% |
| Celtics | 0.0 /100 | #294 | Tragic 13.3% |
| French | 0.0 /100 | #295 | Tragic 13.3% |
| Nepalese | 0.0 /100 | #296 | Tragic 13.3% |
| Slovaks | 0.0 /100 | #297 | Tragic 13.3% |
| Immigrants | Nonimmigrants | 0.0 /100 | #298 | Tragic 13.4% |
| Immigrants | Dominican Republic | 0.0 /100 | #299 | Tragic 13.4% |
| Pennsylvania Germans | 0.0 /100 | #300 | Tragic 13.4% |
| Africans | 0.0 /100 | #301 | Tragic 13.4% |
Demographics Similar to Arabs by Female Disability
In terms of female disability, the demographic groups most similar to Arabs are Nicaraguan (11.9%, a difference of 0.030%), Macedonian (11.8%, a difference of 0.090%), Immigrants from Syria (11.9%, a difference of 0.10%), Kenyan (11.9%, a difference of 0.11%), and Immigrants from Nicaragua (11.9%, a difference of 0.11%).
| Demographics | Rating | Rank | Female Disability |
| Russians | 96.5 /100 | #124 | Exceptional 11.8% |
| Immigrants | Italy | 96.4 /100 | #125 | Exceptional 11.8% |
| Immigrants | Europe | 96.2 /100 | #126 | Exceptional 11.8% |
| South American Indians | 95.8 /100 | #127 | Exceptional 11.8% |
| Immigrants | Latvia | 95.6 /100 | #128 | Exceptional 11.8% |
| Macedonians | 95.5 /100 | #129 | Exceptional 11.8% |
| Nicaraguans | 95.2 /100 | #130 | Exceptional 11.9% |
| Arabs | 95.1 /100 | #131 | Exceptional 11.9% |
| Immigrants | Syria | 94.6 /100 | #132 | Exceptional 11.9% |
| Kenyans | 94.5 /100 | #133 | Exceptional 11.9% |
| Immigrants | Nicaragua | 94.5 /100 | #134 | Exceptional 11.9% |
| Central Americans | 94.2 /100 | #135 | Exceptional 11.9% |
| Ugandans | 94.0 /100 | #136 | Exceptional 11.9% |
| Immigrants | Norway | 93.8 /100 | #137 | Exceptional 11.9% |
| Ecuadorians | 93.4 /100 | #138 | Exceptional 11.9% |