Celtic vs Inupiat Female Disability
COMPARE
Celtic
Inupiat
Female Disability
Female Disability Comparison
Celtics
Inupiat
13.3%
FEMALE DISABILITY
0.0/ 100
METRIC RATING
294th/ 347
METRIC RANK
11.3%
FEMALE DISABILITY
100.0/ 100
METRIC RATING
50th/ 347
METRIC RANK
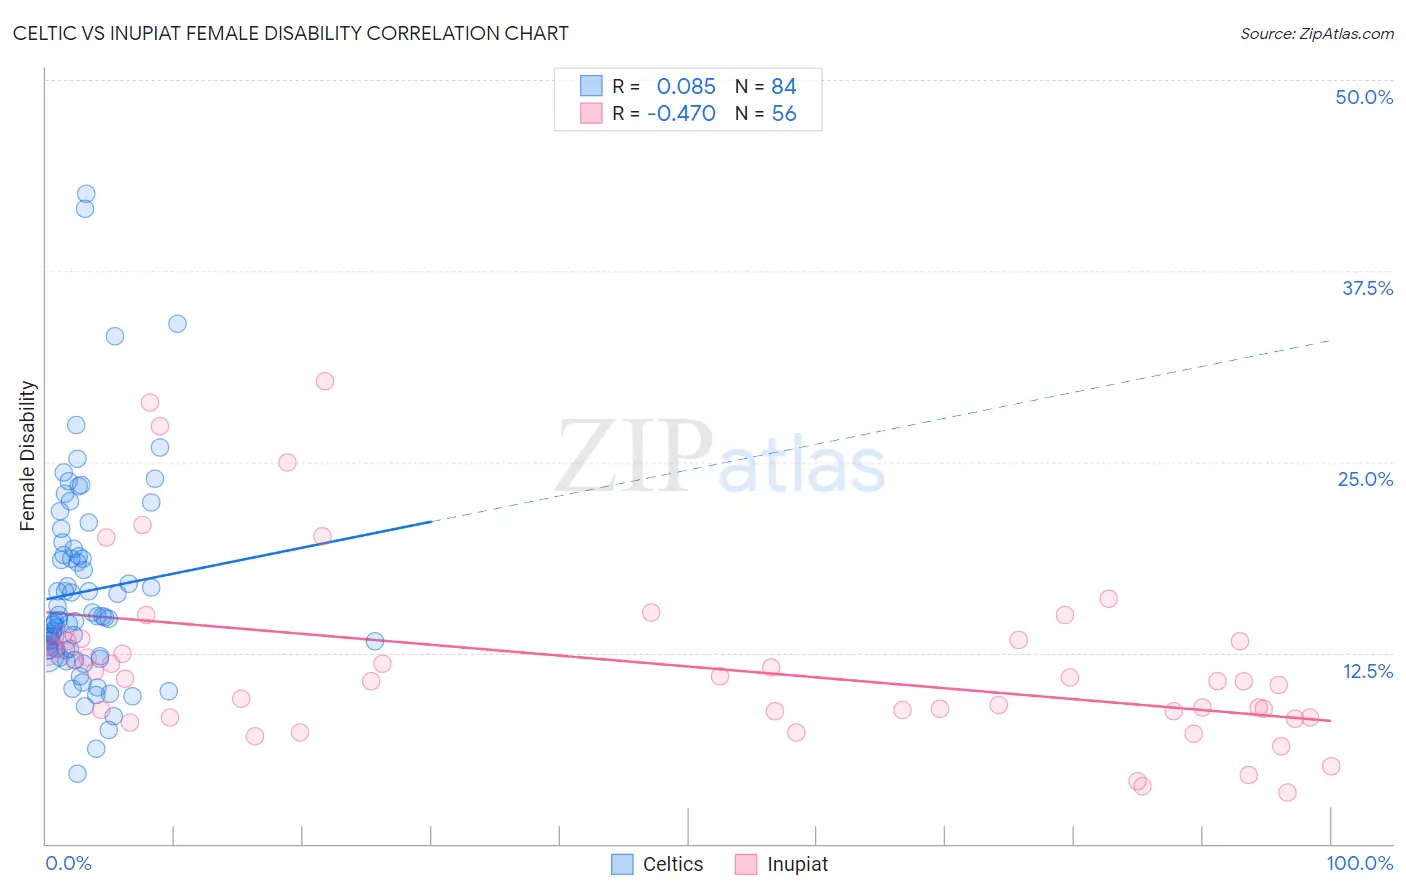
Celtic vs Inupiat Female Disability Correlation Chart
The statistical analysis conducted on geographies consisting of 168,857,089 people shows a slight positive correlation between the proportion of Celtics and percentage of females with a disability in the United States with a correlation coefficient (R) of 0.085 and weighted average of 13.3%. Similarly, the statistical analysis conducted on geographies consisting of 96,332,490 people shows a moderate negative correlation between the proportion of Inupiat and percentage of females with a disability in the United States with a correlation coefficient (R) of -0.470 and weighted average of 11.3%, a difference of 17.5%.
Female Disability Correlation Summary
| Measurement | Celtic | Inupiat |
| Minimum | 4.6% | 3.4% |
| Maximum | 42.6% | 30.3% |
| Range | 38.0% | 26.9% |
| Mean | 16.5% | 11.8% |
| Median | 14.7% | 10.7% |
| Interquartile 25% (IQ1) | 12.7% | 8.5% |
| Interquartile 75% (IQ3) | 18.9% | 13.3% |
| Interquartile Range (IQR) | 6.2% | 4.8% |
| Standard Deviation (Sample) | 6.8% | 5.9% |
| Standard Deviation (Population) | 6.7% | 5.8% |
Similar Demographics by Female Disability
Demographics Similar to Celtics by Female Disability
In terms of female disability, the demographic groups most similar to Celtics are Marshallese (13.3%, a difference of 0.050%), French (13.3%, a difference of 0.21%), Yakama (13.2%, a difference of 0.31%), Nepalese (13.3%, a difference of 0.34%), and Slovak (13.3%, a difference of 0.38%).
| Demographics | Rating | Rank | Female Disability |
| Yaqui | 0.0 /100 | #287 | Tragic 13.2% |
| Whites/Caucasians | 0.0 /100 | #288 | Tragic 13.2% |
| Tlingit-Haida | 0.0 /100 | #289 | Tragic 13.2% |
| Immigrants | Yemen | 0.0 /100 | #290 | Tragic 13.2% |
| Shoshone | 0.0 /100 | #291 | Tragic 13.2% |
| Yakama | 0.0 /100 | #292 | Tragic 13.2% |
| Marshallese | 0.0 /100 | #293 | Tragic 13.3% |
| Celtics | 0.0 /100 | #294 | Tragic 13.3% |
| French | 0.0 /100 | #295 | Tragic 13.3% |
| Nepalese | 0.0 /100 | #296 | Tragic 13.3% |
| Slovaks | 0.0 /100 | #297 | Tragic 13.3% |
| Immigrants | Nonimmigrants | 0.0 /100 | #298 | Tragic 13.4% |
| Immigrants | Dominican Republic | 0.0 /100 | #299 | Tragic 13.4% |
| Pennsylvania Germans | 0.0 /100 | #300 | Tragic 13.4% |
| Africans | 0.0 /100 | #301 | Tragic 13.4% |
Demographics Similar to Inupiat by Female Disability
In terms of female disability, the demographic groups most similar to Inupiat are Immigrants from Belgium (11.3%, a difference of 0.080%), Immigrants from Peru (11.3%, a difference of 0.20%), Tongan (11.3%, a difference of 0.23%), Jordanian (11.3%, a difference of 0.24%), and Zimbabwean (11.3%, a difference of 0.24%).
| Demographics | Rating | Rank | Female Disability |
| Afghans | 100.0 /100 | #43 | Exceptional 11.2% |
| Cambodians | 100.0 /100 | #44 | Exceptional 11.3% |
| Immigrants | Sweden | 100.0 /100 | #45 | Exceptional 11.3% |
| Immigrants | Nepal | 100.0 /100 | #46 | Exceptional 11.3% |
| Jordanians | 100.0 /100 | #47 | Exceptional 11.3% |
| Zimbabweans | 100.0 /100 | #48 | Exceptional 11.3% |
| Tongans | 100.0 /100 | #49 | Exceptional 11.3% |
| Inupiat | 100.0 /100 | #50 | Exceptional 11.3% |
| Immigrants | Belgium | 100.0 /100 | #51 | Exceptional 11.3% |
| Immigrants | Peru | 99.9 /100 | #52 | Exceptional 11.3% |
| Immigrants | Saudi Arabia | 99.9 /100 | #53 | Exceptional 11.3% |
| Peruvians | 99.9 /100 | #54 | Exceptional 11.3% |
| Bulgarians | 99.9 /100 | #55 | Exceptional 11.3% |
| Taiwanese | 99.9 /100 | #56 | Exceptional 11.4% |
| South Americans | 99.9 /100 | #57 | Exceptional 11.4% |