Immigrants from Thailand vs Immigrants from Guatemala Female Disability
COMPARE
Immigrants from Thailand
Immigrants from Guatemala
Female Disability
Female Disability Comparison
Immigrants from Thailand
Immigrants from Guatemala
12.4%
FEMALE DISABILITY
14.5/ 100
METRIC RATING
213th/ 347
METRIC RANK
12.1%
FEMALE DISABILITY
66.0/ 100
METRIC RATING
160th/ 347
METRIC RANK
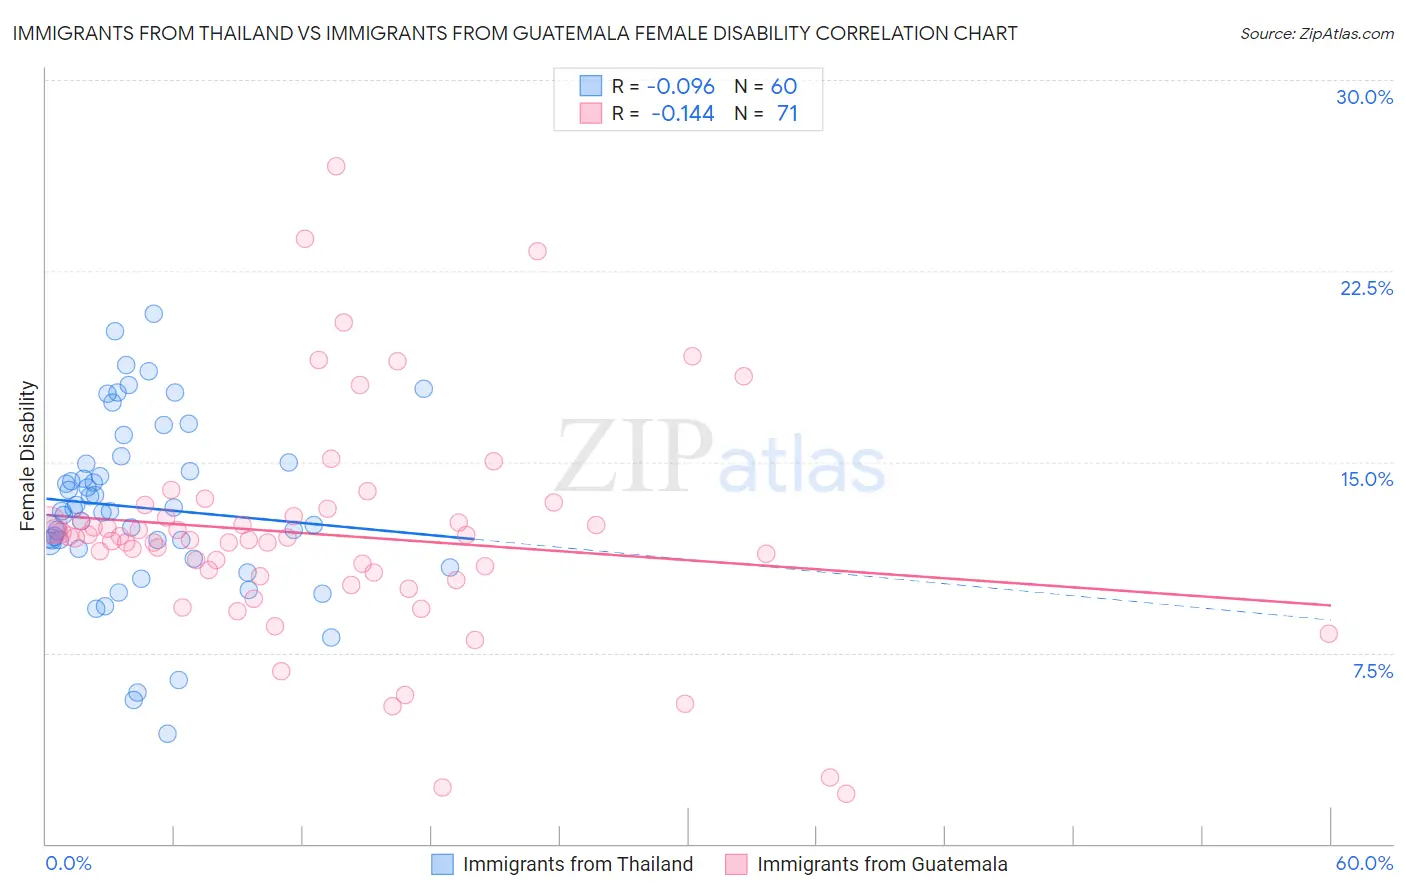
Immigrants from Thailand vs Immigrants from Guatemala Female Disability Correlation Chart
The statistical analysis conducted on geographies consisting of 316,982,742 people shows a slight negative correlation between the proportion of Immigrants from Thailand and percentage of females with a disability in the United States with a correlation coefficient (R) of -0.096 and weighted average of 12.4%. Similarly, the statistical analysis conducted on geographies consisting of 377,228,850 people shows a poor negative correlation between the proportion of Immigrants from Guatemala and percentage of females with a disability in the United States with a correlation coefficient (R) of -0.144 and weighted average of 12.1%, a difference of 2.3%.
Female Disability Correlation Summary
| Measurement | Immigrants from Thailand | Immigrants from Guatemala |
| Minimum | 4.3% | 2.0% |
| Maximum | 20.8% | 26.6% |
| Range | 16.5% | 24.7% |
| Mean | 13.2% | 12.1% |
| Median | 13.1% | 12.0% |
| Interquartile 25% (IQ1) | 11.7% | 10.5% |
| Interquartile 75% (IQ3) | 15.0% | 12.9% |
| Interquartile Range (IQR) | 3.3% | 2.4% |
| Standard Deviation (Sample) | 3.5% | 4.4% |
| Standard Deviation (Population) | 3.4% | 4.3% |
Similar Demographics by Female Disability
Demographics Similar to Immigrants from Thailand by Female Disability
In terms of female disability, the demographic groups most similar to Immigrants from Thailand are Ute (12.4%, a difference of 0.020%), Swiss (12.4%, a difference of 0.030%), Immigrants from Bosnia and Herzegovina (12.4%, a difference of 0.030%), Panamanian (12.4%, a difference of 0.080%), and Samoan (12.4%, a difference of 0.080%).
| Demographics | Rating | Rank | Female Disability |
| Immigrants | Cuba | 20.2 /100 | #206 | Fair 12.4% |
| Croatians | 20.2 /100 | #207 | Fair 12.4% |
| Basques | 17.5 /100 | #208 | Poor 12.4% |
| Mexicans | 15.7 /100 | #209 | Poor 12.4% |
| Swiss | 14.9 /100 | #210 | Poor 12.4% |
| Immigrants | Bosnia and Herzegovina | 14.8 /100 | #211 | Poor 12.4% |
| Ute | 14.7 /100 | #212 | Poor 12.4% |
| Immigrants | Thailand | 14.5 /100 | #213 | Poor 12.4% |
| Panamanians | 13.5 /100 | #214 | Poor 12.4% |
| Samoans | 13.4 /100 | #215 | Poor 12.4% |
| Immigrants | Burma/Myanmar | 13.3 /100 | #216 | Poor 12.4% |
| British | 12.7 /100 | #217 | Poor 12.4% |
| Immigrants | Bahamas | 12.5 /100 | #218 | Poor 12.4% |
| Europeans | 12.1 /100 | #219 | Poor 12.4% |
| Bahamians | 11.1 /100 | #220 | Poor 12.4% |
Demographics Similar to Immigrants from Guatemala by Female Disability
In terms of female disability, the demographic groups most similar to Immigrants from Guatemala are Guyanese (12.1%, a difference of 0.060%), Immigrants from Central America (12.1%, a difference of 0.070%), Immigrants from Ukraine (12.1%, a difference of 0.070%), Guatemalan (12.1%, a difference of 0.090%), and Czech (12.1%, a difference of 0.10%).
| Demographics | Rating | Rank | Female Disability |
| Sudanese | 79.1 /100 | #153 | Good 12.0% |
| Syrians | 76.9 /100 | #154 | Good 12.1% |
| Ghanaians | 76.6 /100 | #155 | Good 12.1% |
| Moroccans | 72.9 /100 | #156 | Good 12.1% |
| Danes | 72.5 /100 | #157 | Good 12.1% |
| Immigrants | Middle Africa | 72.4 /100 | #158 | Good 12.1% |
| Immigrants | Central America | 67.7 /100 | #159 | Good 12.1% |
| Immigrants | Guatemala | 66.0 /100 | #160 | Good 12.1% |
| Guyanese | 64.7 /100 | #161 | Good 12.1% |
| Immigrants | Ukraine | 64.3 /100 | #162 | Good 12.1% |
| Guatemalans | 63.8 /100 | #163 | Good 12.1% |
| Czechs | 63.6 /100 | #164 | Good 12.1% |
| Immigrants | Oceania | 61.8 /100 | #165 | Good 12.1% |
| Lithuanians | 59.5 /100 | #166 | Average 12.2% |
| Immigrants | Latin America | 59.0 /100 | #167 | Average 12.2% |