Celtic vs Immigrants from Guatemala 4 or more Vehicles in Household
COMPARE
Celtic
Immigrants from Guatemala
4 or more Vehicles in Household
4 or more Vehicles in Household Comparison
Celtics
Immigrants from Guatemala
7.1%
4 OR MORE VEHICLES IN HOUSEHOLD
99.1/ 100
METRIC RATING
97th/ 347
METRIC RANK
6.8%
4 OR MORE VEHICLES IN HOUSEHOLD
95.8/ 100
METRIC RATING
116th/ 347
METRIC RANK
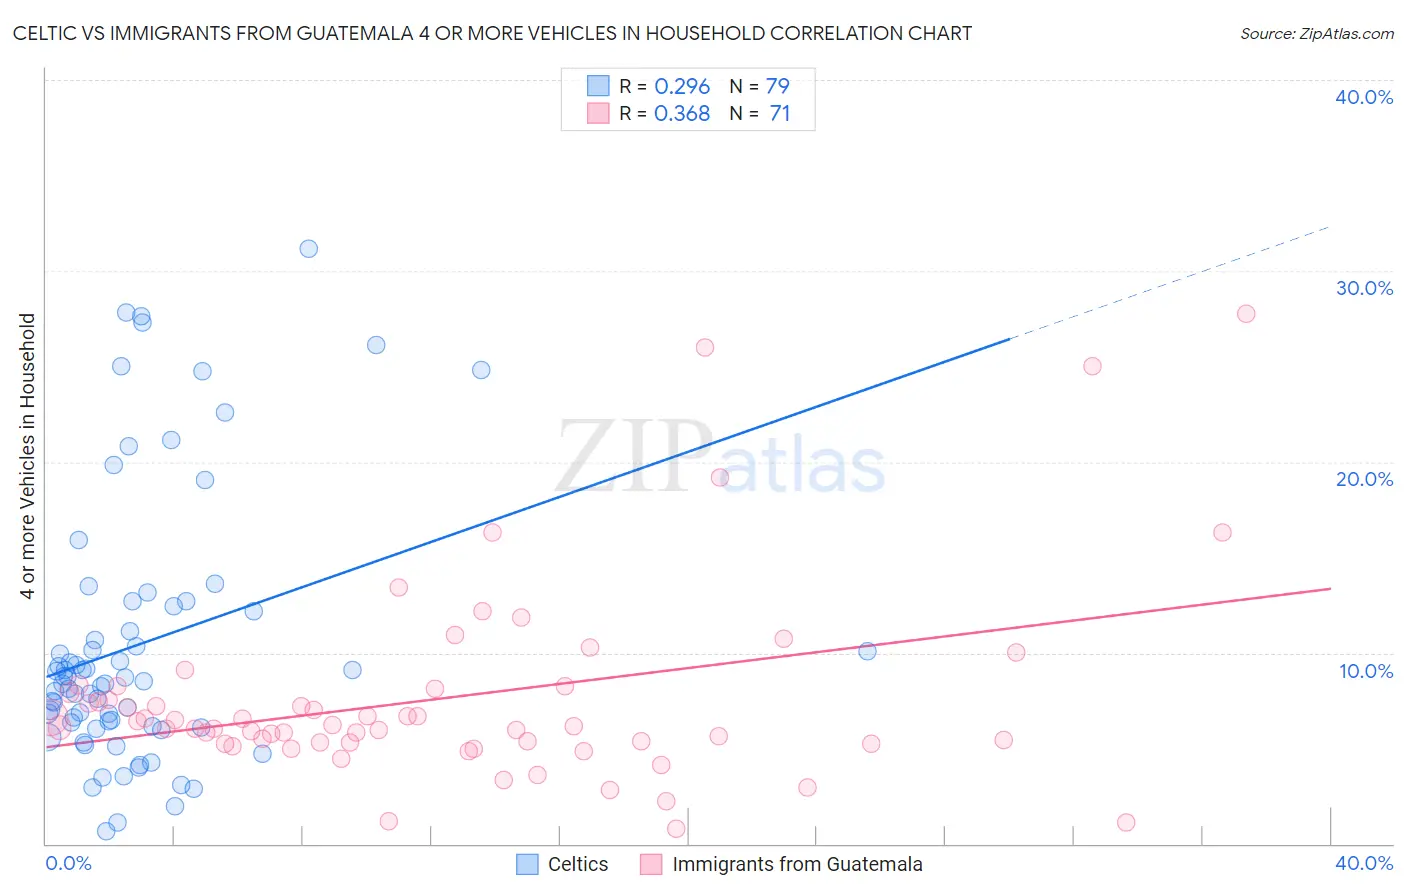
Celtic vs Immigrants from Guatemala 4 or more Vehicles in Household Correlation Chart
The statistical analysis conducted on geographies consisting of 168,678,221 people shows a weak positive correlation between the proportion of Celtics and percentage of households with 4 or more vehicles available in the United States with a correlation coefficient (R) of 0.296 and weighted average of 7.1%. Similarly, the statistical analysis conducted on geographies consisting of 375,931,655 people shows a mild positive correlation between the proportion of Immigrants from Guatemala and percentage of households with 4 or more vehicles available in the United States with a correlation coefficient (R) of 0.368 and weighted average of 6.8%, a difference of 3.8%.
4 or more Vehicles in Household Correlation Summary
| Measurement | Celtic | Immigrants from Guatemala |
| Minimum | 0.62% | 0.78% |
| Maximum | 31.2% | 27.8% |
| Range | 30.6% | 27.0% |
| Mean | 10.5% | 7.6% |
| Median | 8.5% | 6.1% |
| Interquartile 25% (IQ1) | 6.1% | 5.3% |
| Interquartile 75% (IQ3) | 12.5% | 8.1% |
| Interquartile Range (IQR) | 6.3% | 2.9% |
| Standard Deviation (Sample) | 7.0% | 5.1% |
| Standard Deviation (Population) | 7.0% | 5.1% |
Demographics Similar to Celtics and Immigrants from Guatemala by 4 or more Vehicles in Household
In terms of 4 or more vehicles in household, the demographic groups most similar to Celtics are Central American (7.1%, a difference of 0.35%), Irish (7.1%, a difference of 0.42%), Seminole (7.0%, a difference of 0.86%), Taiwanese (7.0%, a difference of 0.94%), and Pakistani (7.0%, a difference of 1.0%). Similarly, the demographic groups most similar to Immigrants from Guatemala are Tlingit-Haida (6.8%, a difference of 0.26%), Bolivian (6.8%, a difference of 0.32%), Canadian (6.9%, a difference of 0.37%), Hopi (6.9%, a difference of 0.79%), and Aleut (6.9%, a difference of 0.80%).
| Demographics | Rating | Rank | 4 or more Vehicles in Household |
| Central Americans | 99.3 /100 | #96 | Exceptional 7.1% |
| Celtics | 99.1 /100 | #97 | Exceptional 7.1% |
| Irish | 99.0 /100 | #98 | Exceptional 7.1% |
| Seminole | 98.8 /100 | #99 | Exceptional 7.0% |
| Taiwanese | 98.7 /100 | #100 | Exceptional 7.0% |
| Pakistanis | 98.7 /100 | #101 | Exceptional 7.0% |
| Asians | 98.6 /100 | #102 | Exceptional 7.0% |
| Blackfeet | 98.6 /100 | #103 | Exceptional 7.0% |
| Hmong | 98.3 /100 | #104 | Exceptional 7.0% |
| German Russians | 98.3 /100 | #105 | Exceptional 7.0% |
| Guatemalans | 98.1 /100 | #106 | Exceptional 7.0% |
| Nicaraguans | 98.0 /100 | #107 | Exceptional 7.0% |
| French | 97.7 /100 | #108 | Exceptional 6.9% |
| Filipinos | 97.6 /100 | #109 | Exceptional 6.9% |
| Immigrants | Thailand | 97.0 /100 | #110 | Exceptional 6.9% |
| Aleuts | 97.0 /100 | #111 | Exceptional 6.9% |
| Hopi | 97.0 /100 | #112 | Exceptional 6.9% |
| Canadians | 96.4 /100 | #113 | Exceptional 6.9% |
| Bolivians | 96.3 /100 | #114 | Exceptional 6.8% |
| Tlingit-Haida | 96.2 /100 | #115 | Exceptional 6.8% |
| Immigrants | Guatemala | 95.8 /100 | #116 | Exceptional 6.8% |