British vs Arab Female Disability
COMPARE
British
Arab
Female Disability
Female Disability Comparison
British
Arabs
12.4%
FEMALE DISABILITY
12.7/ 100
METRIC RATING
217th/ 347
METRIC RANK
11.9%
FEMALE DISABILITY
95.1/ 100
METRIC RATING
131st/ 347
METRIC RANK
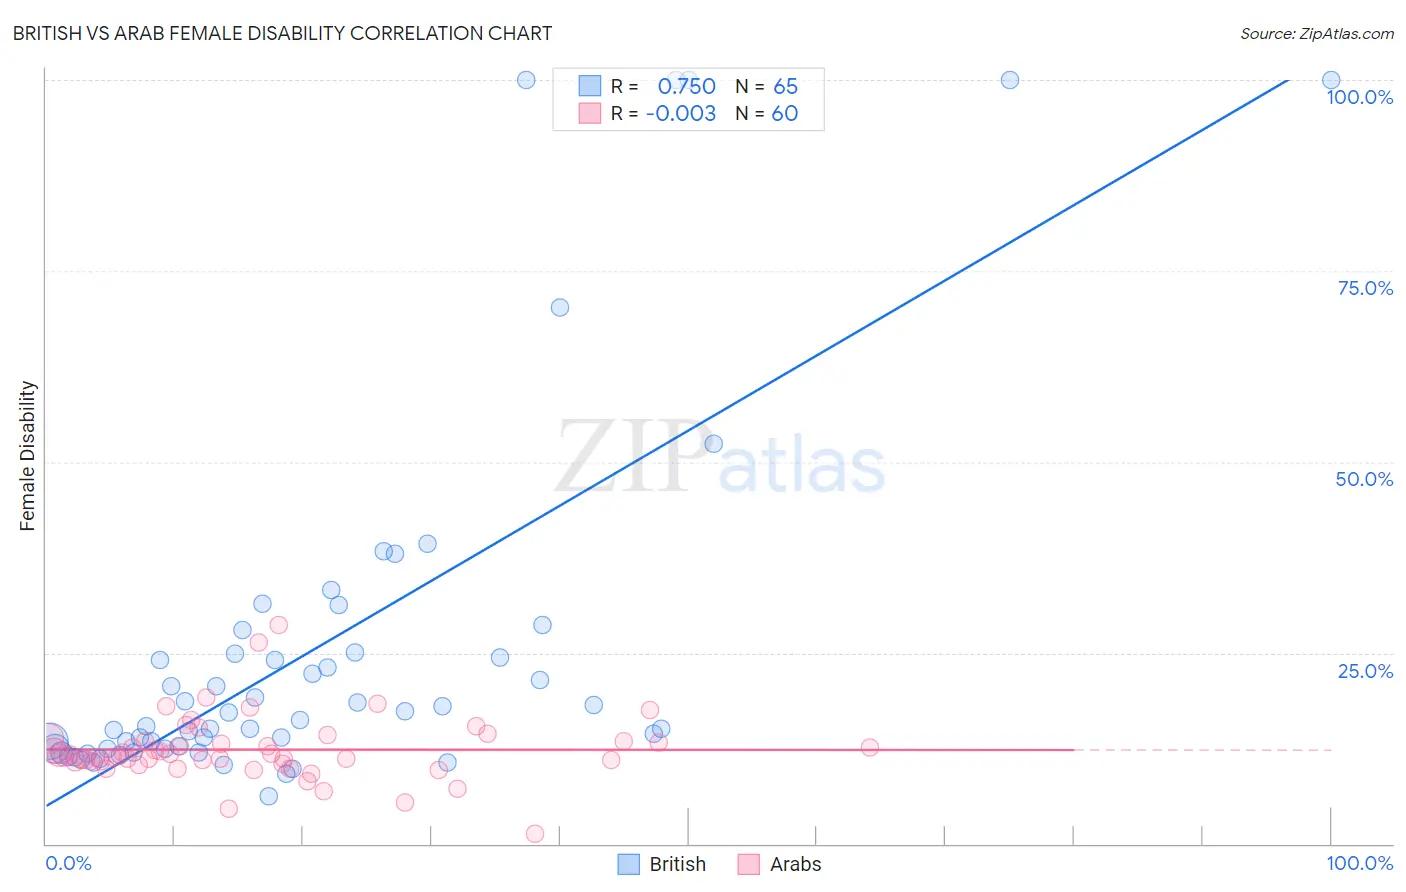
British vs Arab Female Disability Correlation Chart
The statistical analysis conducted on geographies consisting of 531,338,456 people shows a strong positive correlation between the proportion of British and percentage of females with a disability in the United States with a correlation coefficient (R) of 0.750 and weighted average of 12.4%. Similarly, the statistical analysis conducted on geographies consisting of 486,755,725 people shows no correlation between the proportion of Arabs and percentage of females with a disability in the United States with a correlation coefficient (R) of -0.003 and weighted average of 11.9%, a difference of 4.7%.
Female Disability Correlation Summary
| Measurement | British | Arab |
| Minimum | 6.2% | 1.3% |
| Maximum | 100.0% | 28.6% |
| Range | 93.8% | 27.3% |
| Mean | 25.6% | 12.3% |
| Median | 16.2% | 11.5% |
| Interquartile 25% (IQ1) | 12.4% | 10.8% |
| Interquartile 75% (IQ3) | 25.0% | 13.4% |
| Interquartile Range (IQR) | 12.6% | 2.7% |
| Standard Deviation (Sample) | 24.1% | 4.3% |
| Standard Deviation (Population) | 23.9% | 4.2% |
Similar Demographics by Female Disability
Demographics Similar to British by Female Disability
In terms of female disability, the demographic groups most similar to British are Immigrants from Bahamas (12.4%, a difference of 0.020%), Immigrants from Burma/Myanmar (12.4%, a difference of 0.050%), European (12.4%, a difference of 0.050%), Panamanian (12.4%, a difference of 0.060%), and Samoan (12.4%, a difference of 0.060%).
| Demographics | Rating | Rank | Female Disability |
| Swiss | 14.9 /100 | #210 | Poor 12.4% |
| Immigrants | Bosnia and Herzegovina | 14.8 /100 | #211 | Poor 12.4% |
| Ute | 14.7 /100 | #212 | Poor 12.4% |
| Immigrants | Thailand | 14.5 /100 | #213 | Poor 12.4% |
| Panamanians | 13.5 /100 | #214 | Poor 12.4% |
| Samoans | 13.4 /100 | #215 | Poor 12.4% |
| Immigrants | Burma/Myanmar | 13.3 /100 | #216 | Poor 12.4% |
| British | 12.7 /100 | #217 | Poor 12.4% |
| Immigrants | Bahamas | 12.5 /100 | #218 | Poor 12.4% |
| Europeans | 12.1 /100 | #219 | Poor 12.4% |
| Bahamians | 11.1 /100 | #220 | Poor 12.4% |
| Native Hawaiians | 10.8 /100 | #221 | Poor 12.4% |
| Italians | 10.7 /100 | #222 | Poor 12.4% |
| Guamanians/Chamorros | 9.5 /100 | #223 | Tragic 12.5% |
| Belizeans | 9.3 /100 | #224 | Tragic 12.5% |
Demographics Similar to Arabs by Female Disability
In terms of female disability, the demographic groups most similar to Arabs are Nicaraguan (11.9%, a difference of 0.030%), Macedonian (11.8%, a difference of 0.090%), Immigrants from Syria (11.9%, a difference of 0.10%), Kenyan (11.9%, a difference of 0.11%), and Immigrants from Nicaragua (11.9%, a difference of 0.11%).
| Demographics | Rating | Rank | Female Disability |
| Russians | 96.5 /100 | #124 | Exceptional 11.8% |
| Immigrants | Italy | 96.4 /100 | #125 | Exceptional 11.8% |
| Immigrants | Europe | 96.2 /100 | #126 | Exceptional 11.8% |
| South American Indians | 95.8 /100 | #127 | Exceptional 11.8% |
| Immigrants | Latvia | 95.6 /100 | #128 | Exceptional 11.8% |
| Macedonians | 95.5 /100 | #129 | Exceptional 11.8% |
| Nicaraguans | 95.2 /100 | #130 | Exceptional 11.9% |
| Arabs | 95.1 /100 | #131 | Exceptional 11.9% |
| Immigrants | Syria | 94.6 /100 | #132 | Exceptional 11.9% |
| Kenyans | 94.5 /100 | #133 | Exceptional 11.9% |
| Immigrants | Nicaragua | 94.5 /100 | #134 | Exceptional 11.9% |
| Central Americans | 94.2 /100 | #135 | Exceptional 11.9% |
| Ugandans | 94.0 /100 | #136 | Exceptional 11.9% |
| Immigrants | Norway | 93.8 /100 | #137 | Exceptional 11.9% |
| Ecuadorians | 93.4 /100 | #138 | Exceptional 11.9% |