Celtic vs Arab Median Household Income
COMPARE
Celtic
Arab
Median Household Income
Median Household Income Comparison
Celtics
Arabs
$83,193
MEDIAN HOUSEHOLD INCOME
22.7/ 100
METRIC RATING
205th/ 347
METRIC RANK
$88,398
MEDIAN HOUSEHOLD INCOME
89.2/ 100
METRIC RATING
138th/ 347
METRIC RANK
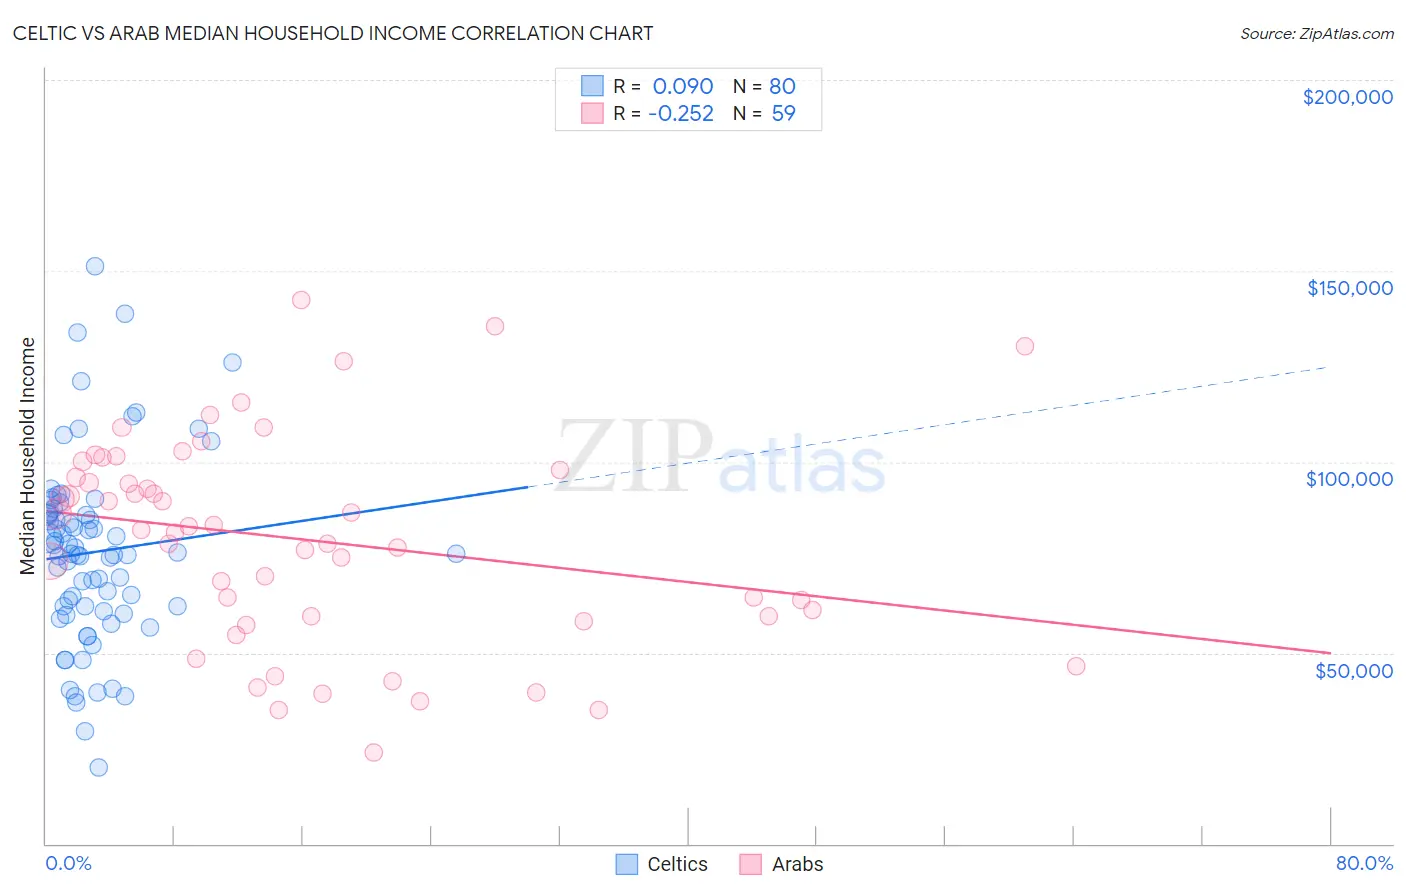
Celtic vs Arab Median Household Income Correlation Chart
The statistical analysis conducted on geographies consisting of 168,842,689 people shows a slight positive correlation between the proportion of Celtics and median household income in the United States with a correlation coefficient (R) of 0.090 and weighted average of $83,193. Similarly, the statistical analysis conducted on geographies consisting of 486,242,528 people shows a weak negative correlation between the proportion of Arabs and median household income in the United States with a correlation coefficient (R) of -0.252 and weighted average of $88,398, a difference of 6.3%.
Median Household Income Correlation Summary
| Measurement | Celtic | Arab |
| Minimum | $19,921 | $23,929 |
| Maximum | $151,161 | $142,260 |
| Range | $131,240 | $118,331 |
| Mean | $76,393 | $79,535 |
| Median | $75,866 | $82,260 |
| Interquartile 25% (IQ1) | $61,507 | $59,535 |
| Interquartile 75% (IQ3) | $86,536 | $97,787 |
| Interquartile Range (IQR) | $25,028 | $38,252 |
| Standard Deviation (Sample) | $24,415 | $27,234 |
| Standard Deviation (Population) | $24,262 | $27,002 |
Similar Demographics by Median Household Income
Demographics Similar to Celtics by Median Household Income
In terms of median household income, the demographic groups most similar to Celtics are Immigrants from Africa ($83,289, a difference of 0.11%), Immigrants from Cambodia ($83,304, a difference of 0.13%), Immigrants from Kenya ($83,068, a difference of 0.15%), Immigrants from Thailand ($83,327, a difference of 0.16%), and Tsimshian ($83,346, a difference of 0.18%).
| Demographics | Rating | Rank | Median Household Income |
| Japanese | 25.1 /100 | #198 | Fair $83,395 |
| Germans | 24.6 /100 | #199 | Fair $83,358 |
| Tsimshian | 24.5 /100 | #200 | Fair $83,346 |
| Spanish | 24.4 /100 | #201 | Fair $83,343 |
| Immigrants | Thailand | 24.3 /100 | #202 | Fair $83,327 |
| Immigrants | Cambodia | 24.0 /100 | #203 | Fair $83,304 |
| Immigrants | Africa | 23.8 /100 | #204 | Fair $83,289 |
| Celtics | 22.7 /100 | #205 | Fair $83,193 |
| Immigrants | Kenya | 21.3 /100 | #206 | Fair $83,068 |
| Dutch | 20.3 /100 | #207 | Fair $82,971 |
| French Canadians | 18.7 /100 | #208 | Poor $82,810 |
| Immigrants | Iraq | 16.7 /100 | #209 | Poor $82,594 |
| Immigrants | Uruguay | 16.4 /100 | #210 | Poor $82,560 |
| Salvadorans | 15.4 /100 | #211 | Poor $82,449 |
| Venezuelans | 15.3 /100 | #212 | Poor $82,432 |
Demographics Similar to Arabs by Median Household Income
In terms of median household income, the demographic groups most similar to Arabs are Immigrants from Chile ($88,388, a difference of 0.010%), Sierra Leonean ($88,463, a difference of 0.070%), Polish ($88,472, a difference of 0.080%), Immigrants from Sierra Leone ($88,498, a difference of 0.11%), and Swedish ($88,524, a difference of 0.14%).
| Demographics | Rating | Rank | Median Household Income |
| Immigrants | Syria | 91.4 /100 | #131 | Exceptional $88,792 |
| Europeans | 91.2 /100 | #132 | Exceptional $88,751 |
| Immigrants | Ethiopia | 90.9 /100 | #133 | Exceptional $88,687 |
| Swedes | 90.0 /100 | #134 | Exceptional $88,524 |
| Immigrants | Sierra Leone | 89.9 /100 | #135 | Excellent $88,498 |
| Poles | 89.7 /100 | #136 | Excellent $88,472 |
| Sierra Leoneans | 89.6 /100 | #137 | Excellent $88,463 |
| Arabs | 89.2 /100 | #138 | Excellent $88,398 |
| Immigrants | Chile | 89.2 /100 | #139 | Excellent $88,388 |
| Lebanese | 87.2 /100 | #140 | Excellent $88,091 |
| Immigrants | Morocco | 86.0 /100 | #141 | Excellent $87,930 |
| Canadians | 84.7 /100 | #142 | Excellent $87,769 |
| Danes | 83.9 /100 | #143 | Excellent $87,676 |
| Serbians | 83.0 /100 | #144 | Excellent $87,572 |
| Ugandans | 82.9 /100 | #145 | Excellent $87,557 |