Iranian vs Arab Female Disability
COMPARE
Iranian
Arab
Female Disability
Female Disability Comparison
Iranians
Arabs
10.6%
FEMALE DISABILITY
100.0/ 100
METRIC RATING
9th/ 347
METRIC RANK
11.9%
FEMALE DISABILITY
95.1/ 100
METRIC RATING
131st/ 347
METRIC RANK
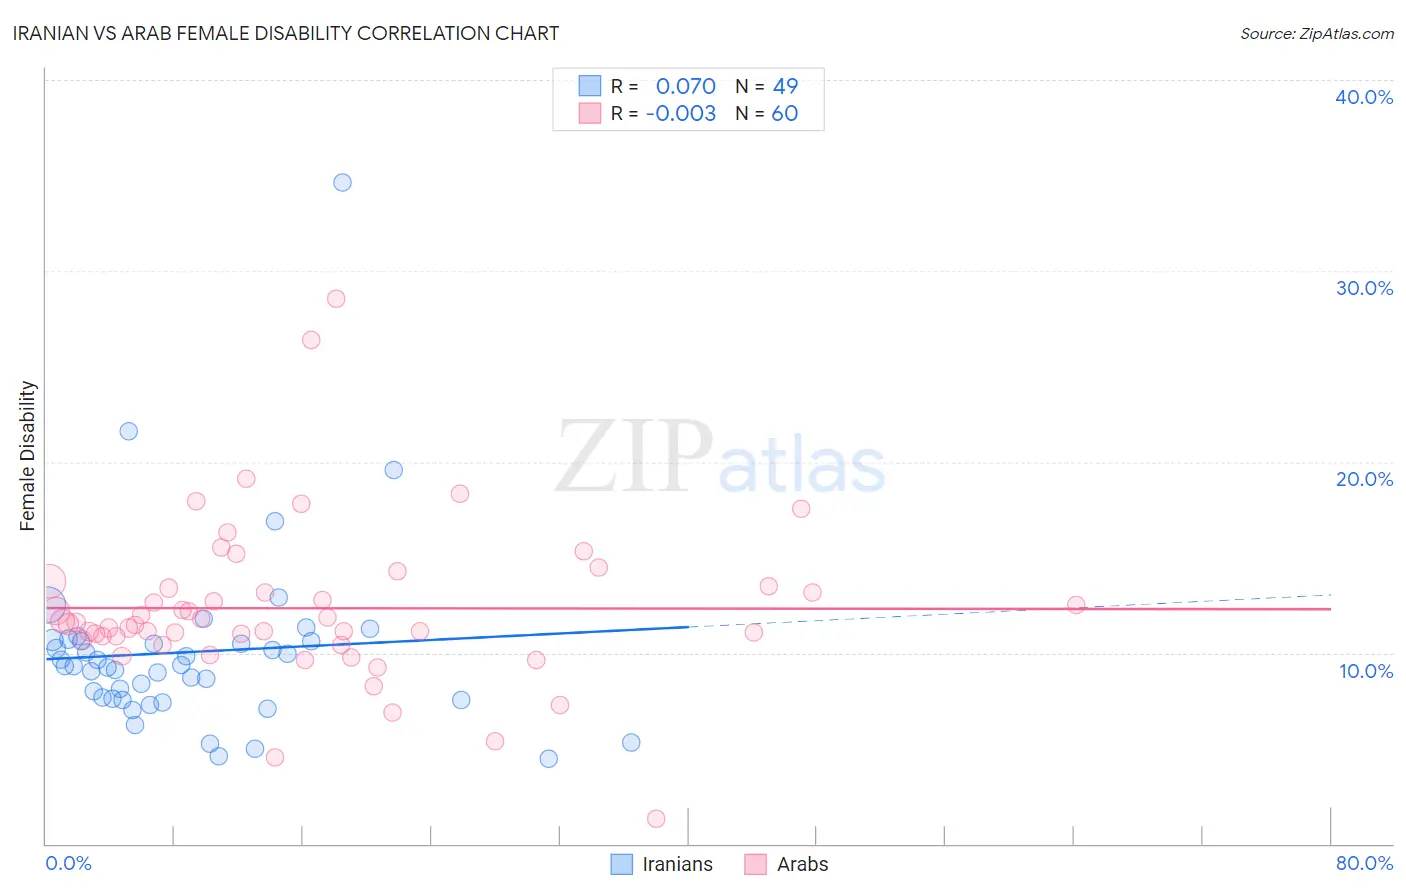
Iranian vs Arab Female Disability Correlation Chart
The statistical analysis conducted on geographies consisting of 316,876,376 people shows a slight positive correlation between the proportion of Iranians and percentage of females with a disability in the United States with a correlation coefficient (R) of 0.070 and weighted average of 10.6%. Similarly, the statistical analysis conducted on geographies consisting of 486,755,725 people shows no correlation between the proportion of Arabs and percentage of females with a disability in the United States with a correlation coefficient (R) of -0.003 and weighted average of 11.9%, a difference of 12.3%.
Female Disability Correlation Summary
| Measurement | Iranian | Arab |
| Minimum | 4.5% | 1.3% |
| Maximum | 34.6% | 28.6% |
| Range | 30.1% | 27.3% |
| Mean | 10.0% | 12.3% |
| Median | 9.3% | 11.5% |
| Interquartile 25% (IQ1) | 7.6% | 10.8% |
| Interquartile 75% (IQ3) | 10.6% | 13.4% |
| Interquartile Range (IQR) | 3.1% | 2.7% |
| Standard Deviation (Sample) | 4.8% | 4.3% |
| Standard Deviation (Population) | 4.8% | 4.2% |
Similar Demographics by Female Disability
Demographics Similar to Iranians by Female Disability
In terms of female disability, the demographic groups most similar to Iranians are Immigrants from Hong Kong (10.6%, a difference of 0.65%), Immigrants from Korea (10.6%, a difference of 0.82%), Immigrants from South Central Asia (10.5%, a difference of 0.91%), Immigrants from Singapore (10.4%, a difference of 1.1%), and Immigrants from Israel (10.7%, a difference of 1.2%).
| Demographics | Rating | Rank | Female Disability |
| Filipinos | 100.0 /100 | #2 | Exceptional 10.1% |
| Immigrants | Taiwan | 100.0 /100 | #3 | Exceptional 10.1% |
| Thais | 100.0 /100 | #4 | Exceptional 10.2% |
| Immigrants | Bolivia | 100.0 /100 | #5 | Exceptional 10.3% |
| Bolivians | 100.0 /100 | #6 | Exceptional 10.4% |
| Immigrants | Singapore | 100.0 /100 | #7 | Exceptional 10.4% |
| Immigrants | South Central Asia | 100.0 /100 | #8 | Exceptional 10.5% |
| Iranians | 100.0 /100 | #9 | Exceptional 10.6% |
| Immigrants | Hong Kong | 100.0 /100 | #10 | Exceptional 10.6% |
| Immigrants | Korea | 100.0 /100 | #11 | Exceptional 10.6% |
| Immigrants | Israel | 100.0 /100 | #12 | Exceptional 10.7% |
| Immigrants | Eastern Asia | 100.0 /100 | #13 | Exceptional 10.7% |
| Immigrants | China | 100.0 /100 | #14 | Exceptional 10.7% |
| Burmese | 100.0 /100 | #15 | Exceptional 10.7% |
| Okinawans | 100.0 /100 | #16 | Exceptional 10.8% |
Demographics Similar to Arabs by Female Disability
In terms of female disability, the demographic groups most similar to Arabs are Nicaraguan (11.9%, a difference of 0.030%), Macedonian (11.8%, a difference of 0.090%), Immigrants from Syria (11.9%, a difference of 0.10%), Kenyan (11.9%, a difference of 0.11%), and Immigrants from Nicaragua (11.9%, a difference of 0.11%).
| Demographics | Rating | Rank | Female Disability |
| Russians | 96.5 /100 | #124 | Exceptional 11.8% |
| Immigrants | Italy | 96.4 /100 | #125 | Exceptional 11.8% |
| Immigrants | Europe | 96.2 /100 | #126 | Exceptional 11.8% |
| South American Indians | 95.8 /100 | #127 | Exceptional 11.8% |
| Immigrants | Latvia | 95.6 /100 | #128 | Exceptional 11.8% |
| Macedonians | 95.5 /100 | #129 | Exceptional 11.8% |
| Nicaraguans | 95.2 /100 | #130 | Exceptional 11.9% |
| Arabs | 95.1 /100 | #131 | Exceptional 11.9% |
| Immigrants | Syria | 94.6 /100 | #132 | Exceptional 11.9% |
| Kenyans | 94.5 /100 | #133 | Exceptional 11.9% |
| Immigrants | Nicaragua | 94.5 /100 | #134 | Exceptional 11.9% |
| Central Americans | 94.2 /100 | #135 | Exceptional 11.9% |
| Ugandans | 94.0 /100 | #136 | Exceptional 11.9% |
| Immigrants | Norway | 93.8 /100 | #137 | Exceptional 11.9% |
| Ecuadorians | 93.4 /100 | #138 | Exceptional 11.9% |