Yugoslavian vs Arab Female Disability
COMPARE
Yugoslavian
Arab
Female Disability
Female Disability Comparison
Yugoslavians
Arabs
12.6%
FEMALE DISABILITY
3.7/ 100
METRIC RATING
238th/ 347
METRIC RANK
11.9%
FEMALE DISABILITY
95.1/ 100
METRIC RATING
131st/ 347
METRIC RANK
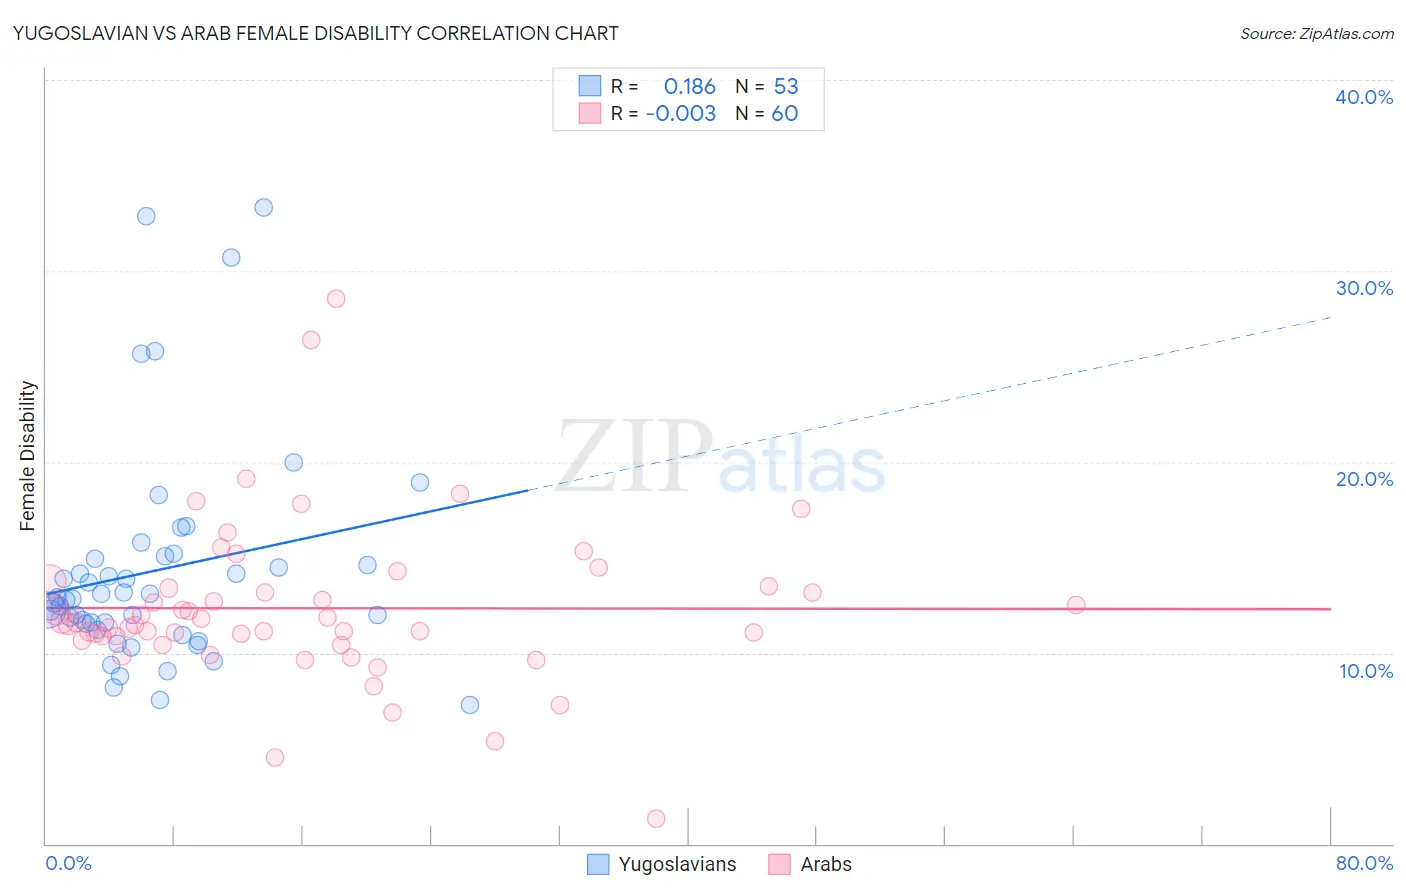
Yugoslavian vs Arab Female Disability Correlation Chart
The statistical analysis conducted on geographies consisting of 285,691,291 people shows a poor positive correlation between the proportion of Yugoslavians and percentage of females with a disability in the United States with a correlation coefficient (R) of 0.186 and weighted average of 12.6%. Similarly, the statistical analysis conducted on geographies consisting of 486,755,725 people shows no correlation between the proportion of Arabs and percentage of females with a disability in the United States with a correlation coefficient (R) of -0.003 and weighted average of 11.9%, a difference of 6.0%.
Female Disability Correlation Summary
| Measurement | Yugoslavian | Arab |
| Minimum | 7.3% | 1.3% |
| Maximum | 33.3% | 28.6% |
| Range | 26.1% | 27.3% |
| Mean | 14.3% | 12.3% |
| Median | 12.9% | 11.5% |
| Interquartile 25% (IQ1) | 11.4% | 10.8% |
| Interquartile 75% (IQ3) | 15.0% | 13.4% |
| Interquartile Range (IQR) | 3.6% | 2.7% |
| Standard Deviation (Sample) | 5.7% | 4.3% |
| Standard Deviation (Population) | 5.7% | 4.2% |
Similar Demographics by Female Disability
Demographics Similar to Yugoslavians by Female Disability
In terms of female disability, the demographic groups most similar to Yugoslavians are Slavic (12.6%, a difference of 0.030%), Barbadian (12.6%, a difference of 0.030%), German Russian (12.6%, a difference of 0.13%), Immigrants from West Indies (12.6%, a difference of 0.15%), and Malaysian (12.5%, a difference of 0.28%).
| Demographics | Rating | Rank | Female Disability |
| Belgians | 6.5 /100 | #231 | Tragic 12.5% |
| Immigrants | Somalia | 5.9 /100 | #232 | Tragic 12.5% |
| Immigrants | Iraq | 5.3 /100 | #233 | Tragic 12.5% |
| Scandinavians | 5.3 /100 | #234 | Tragic 12.5% |
| Malaysians | 5.0 /100 | #235 | Tragic 12.5% |
| Immigrants | West Indies | 4.4 /100 | #236 | Tragic 12.6% |
| Slavs | 3.8 /100 | #237 | Tragic 12.6% |
| Yugoslavians | 3.7 /100 | #238 | Tragic 12.6% |
| Barbadians | 3.6 /100 | #239 | Tragic 12.6% |
| German Russians | 3.2 /100 | #240 | Tragic 12.6% |
| Japanese | 2.7 /100 | #241 | Tragic 12.6% |
| Canadians | 2.6 /100 | #242 | Tragic 12.6% |
| Immigrants | Senegal | 2.5 /100 | #243 | Tragic 12.6% |
| Alsatians | 2.5 /100 | #244 | Tragic 12.6% |
| Immigrants | Jamaica | 2.2 /100 | #245 | Tragic 12.6% |
Demographics Similar to Arabs by Female Disability
In terms of female disability, the demographic groups most similar to Arabs are Nicaraguan (11.9%, a difference of 0.030%), Macedonian (11.8%, a difference of 0.090%), Immigrants from Syria (11.9%, a difference of 0.10%), Kenyan (11.9%, a difference of 0.11%), and Immigrants from Nicaragua (11.9%, a difference of 0.11%).
| Demographics | Rating | Rank | Female Disability |
| Russians | 96.5 /100 | #124 | Exceptional 11.8% |
| Immigrants | Italy | 96.4 /100 | #125 | Exceptional 11.8% |
| Immigrants | Europe | 96.2 /100 | #126 | Exceptional 11.8% |
| South American Indians | 95.8 /100 | #127 | Exceptional 11.8% |
| Immigrants | Latvia | 95.6 /100 | #128 | Exceptional 11.8% |
| Macedonians | 95.5 /100 | #129 | Exceptional 11.8% |
| Nicaraguans | 95.2 /100 | #130 | Exceptional 11.9% |
| Arabs | 95.1 /100 | #131 | Exceptional 11.9% |
| Immigrants | Syria | 94.6 /100 | #132 | Exceptional 11.9% |
| Kenyans | 94.5 /100 | #133 | Exceptional 11.9% |
| Immigrants | Nicaragua | 94.5 /100 | #134 | Exceptional 11.9% |
| Central Americans | 94.2 /100 | #135 | Exceptional 11.9% |
| Ugandans | 94.0 /100 | #136 | Exceptional 11.9% |
| Immigrants | Norway | 93.8 /100 | #137 | Exceptional 11.9% |
| Ecuadorians | 93.4 /100 | #138 | Exceptional 11.9% |