Pima vs Chinese Self-Care Disability
COMPARE
Pima
Chinese
Self-Care Disability
Self-Care Disability Comparison
Pima
Chinese
2.8%
SELF-CARE DISABILITY
0.0/ 100
METRIC RATING
301st/ 347
METRIC RANK
2.6%
SELF-CARE DISABILITY
2.9/ 100
METRIC RATING
226th/ 347
METRIC RANK
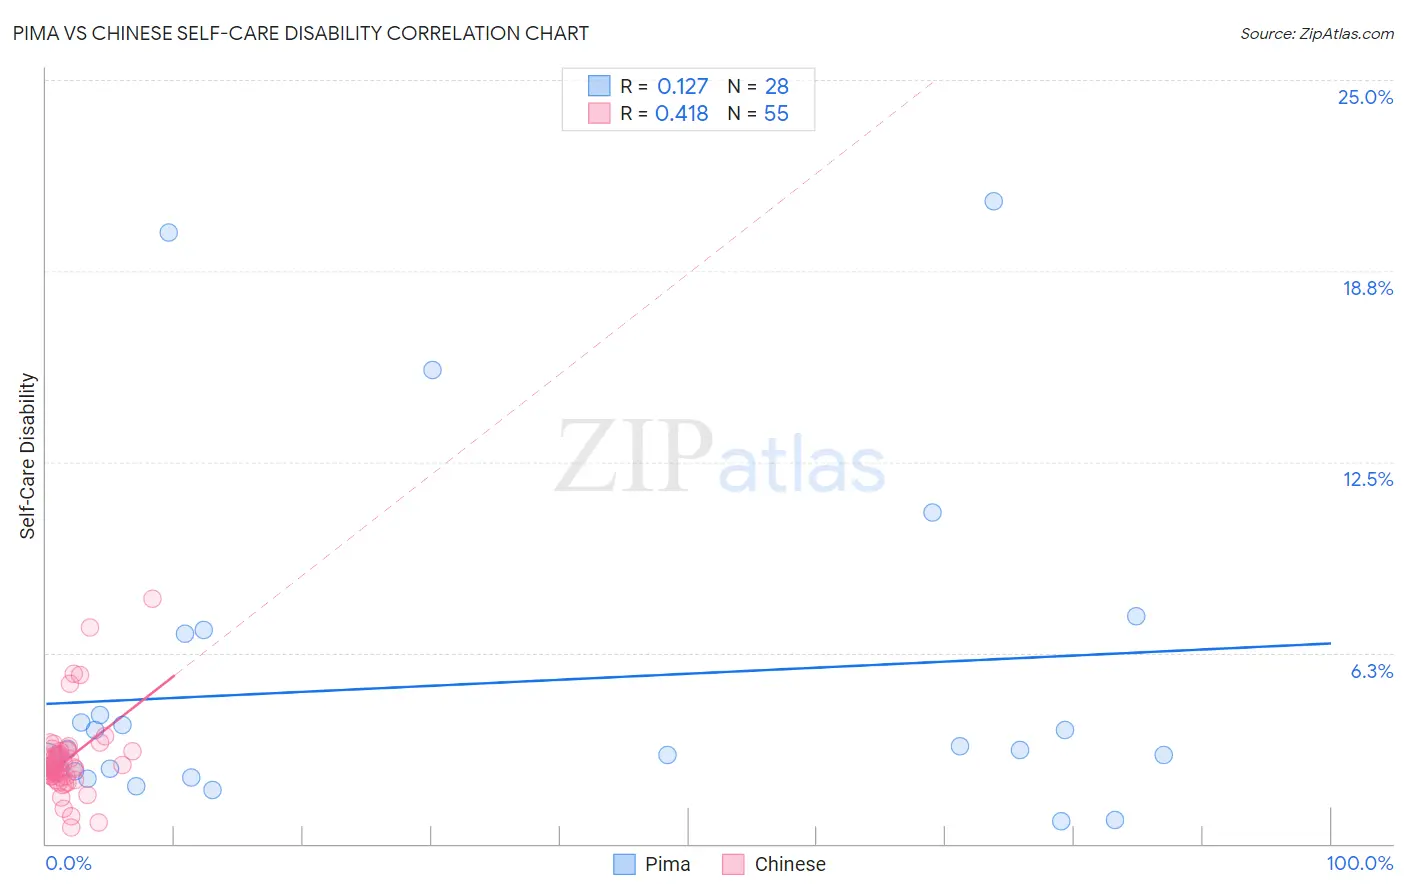
Pima vs Chinese Self-Care Disability Correlation Chart
The statistical analysis conducted on geographies consisting of 61,528,546 people shows a poor positive correlation between the proportion of Pima and percentage of population with self-care disability in the United States with a correlation coefficient (R) of 0.127 and weighted average of 2.8%. Similarly, the statistical analysis conducted on geographies consisting of 64,799,357 people shows a moderate positive correlation between the proportion of Chinese and percentage of population with self-care disability in the United States with a correlation coefficient (R) of 0.418 and weighted average of 2.6%, a difference of 8.2%.
Self-Care Disability Correlation Summary
| Measurement | Pima | Chinese |
| Minimum | 0.75% | 0.55% |
| Maximum | 21.0% | 8.0% |
| Range | 20.3% | 7.4% |
| Mean | 5.2% | 2.8% |
| Median | 3.1% | 2.5% |
| Interquartile 25% (IQ1) | 2.4% | 2.2% |
| Interquartile 75% (IQ3) | 5.5% | 3.0% |
| Interquartile Range (IQR) | 3.1% | 0.82% |
| Standard Deviation (Sample) | 5.3% | 1.3% |
| Standard Deviation (Population) | 5.2% | 1.3% |
Similar Demographics by Self-Care Disability
Demographics Similar to Pima by Self-Care Disability
In terms of self-care disability, the demographic groups most similar to Pima are Immigrants from St. Vincent and the Grenadines (2.8%, a difference of 0.040%), Immigrants from Fiji (2.8%, a difference of 0.090%), Immigrants from Belize (2.8%, a difference of 0.18%), Cree (2.8%, a difference of 0.34%), and Immigrants from West Indies (2.8%, a difference of 0.39%).
| Demographics | Rating | Rank | Self-Care Disability |
| Blackfeet | 0.0 /100 | #294 | Tragic 2.7% |
| Barbadians | 0.0 /100 | #295 | Tragic 2.7% |
| Immigrants | Portugal | 0.0 /100 | #296 | Tragic 2.8% |
| West Indians | 0.0 /100 | #297 | Tragic 2.8% |
| Americans | 0.0 /100 | #298 | Tragic 2.8% |
| Immigrants | Guyana | 0.0 /100 | #299 | Tragic 2.8% |
| Immigrants | Fiji | 0.0 /100 | #300 | Tragic 2.8% |
| Pima | 0.0 /100 | #301 | Tragic 2.8% |
| Immigrants | St. Vincent and the Grenadines | 0.0 /100 | #302 | Tragic 2.8% |
| Immigrants | Belize | 0.0 /100 | #303 | Tragic 2.8% |
| Cree | 0.0 /100 | #304 | Tragic 2.8% |
| Immigrants | West Indies | 0.0 /100 | #305 | Tragic 2.8% |
| Aleuts | 0.0 /100 | #306 | Tragic 2.8% |
| Natives/Alaskans | 0.0 /100 | #307 | Tragic 2.8% |
| Immigrants | Grenada | 0.0 /100 | #308 | Tragic 2.8% |
Demographics Similar to Chinese by Self-Care Disability
In terms of self-care disability, the demographic groups most similar to Chinese are Immigrants from Philippines (2.6%, a difference of 0.080%), Guatemalan (2.6%, a difference of 0.090%), Iraqi (2.6%, a difference of 0.10%), Guamanian/Chamorro (2.6%, a difference of 0.16%), and Immigrants from Ecuador (2.6%, a difference of 0.16%).
| Demographics | Rating | Rank | Self-Care Disability |
| Immigrants | Moldova | 4.0 /100 | #219 | Tragic 2.6% |
| Sub-Saharan Africans | 4.0 /100 | #220 | Tragic 2.6% |
| Hondurans | 3.8 /100 | #221 | Tragic 2.6% |
| Spaniards | 3.8 /100 | #222 | Tragic 2.6% |
| French Canadians | 3.8 /100 | #223 | Tragic 2.6% |
| Osage | 3.6 /100 | #224 | Tragic 2.6% |
| Iraqis | 3.2 /100 | #225 | Tragic 2.6% |
| Chinese | 2.9 /100 | #226 | Tragic 2.6% |
| Immigrants | Philippines | 2.7 /100 | #227 | Tragic 2.6% |
| Guatemalans | 2.7 /100 | #228 | Tragic 2.6% |
| Guamanians/Chamorros | 2.5 /100 | #229 | Tragic 2.6% |
| Immigrants | Ecuador | 2.5 /100 | #230 | Tragic 2.6% |
| Immigrants | Guatemala | 2.2 /100 | #231 | Tragic 2.6% |
| Albanians | 2.2 /100 | #232 | Tragic 2.6% |
| Liberians | 2.1 /100 | #233 | Tragic 2.6% |