Cajun vs Immigrants from Laos Disability
COMPARE
Cajun
Immigrants from Laos
Disability
Disability Comparison
Cajuns
Immigrants from Laos
14.6%
DISABILITY
0.0/ 100
METRIC RATING
333rd/ 347
METRIC RANK
12.4%
DISABILITY
0.5/ 100
METRIC RATING
257th/ 347
METRIC RANK
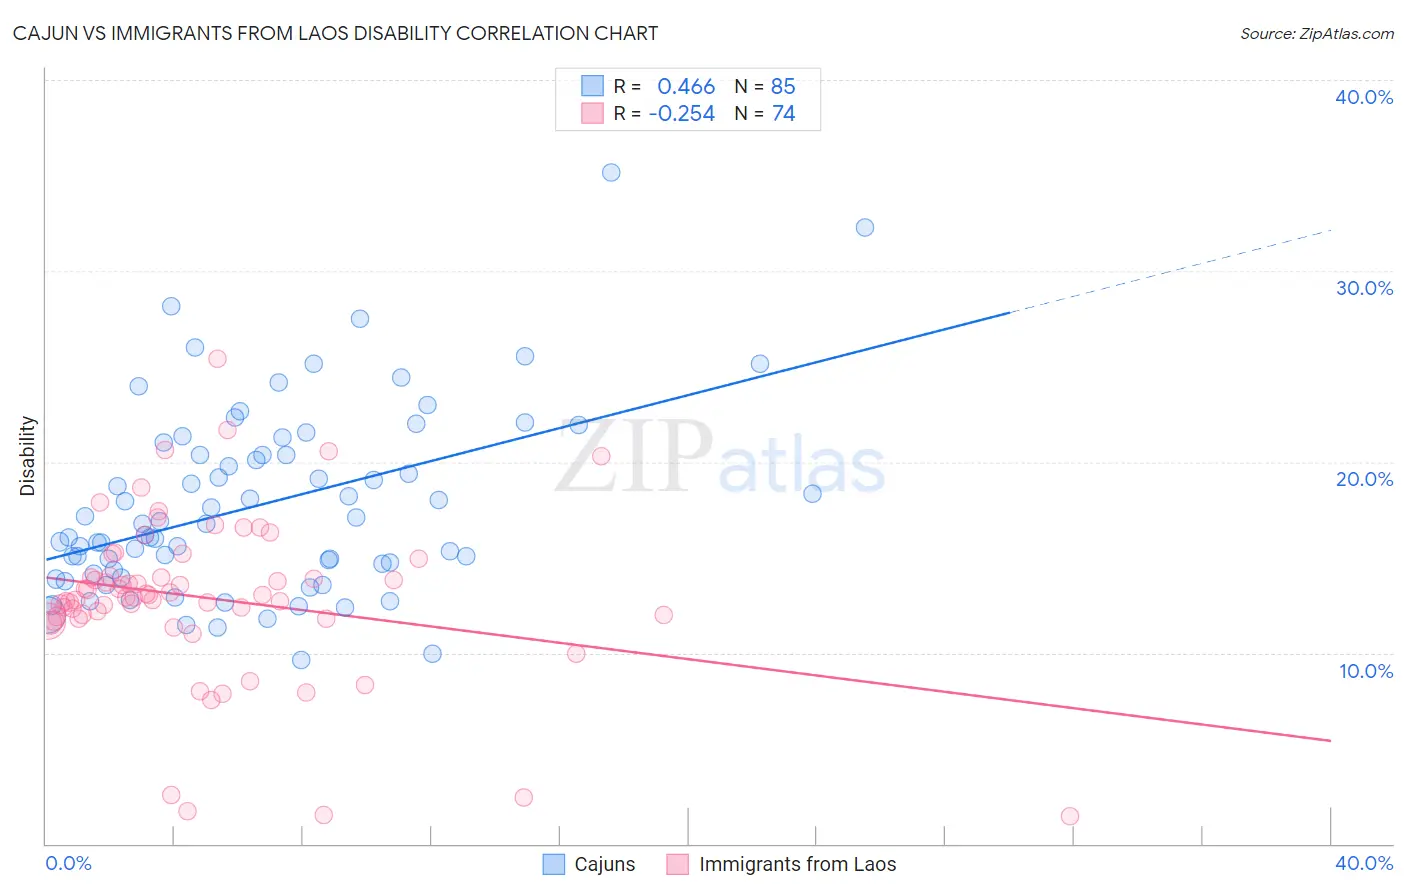
Cajun vs Immigrants from Laos Disability Correlation Chart
The statistical analysis conducted on geographies consisting of 149,702,868 people shows a moderate positive correlation between the proportion of Cajuns and percentage of population with a disability in the United States with a correlation coefficient (R) of 0.466 and weighted average of 14.6%. Similarly, the statistical analysis conducted on geographies consisting of 201,466,628 people shows a weak negative correlation between the proportion of Immigrants from Laos and percentage of population with a disability in the United States with a correlation coefficient (R) of -0.254 and weighted average of 12.4%, a difference of 17.9%.
Disability Correlation Summary
| Measurement | Cajun | Immigrants from Laos |
| Minimum | 9.6% | 1.4% |
| Maximum | 35.2% | 25.4% |
| Range | 25.5% | 24.0% |
| Mean | 17.8% | 12.9% |
| Median | 16.7% | 13.0% |
| Interquartile 25% (IQ1) | 14.3% | 11.8% |
| Interquartile 75% (IQ3) | 20.7% | 14.0% |
| Interquartile Range (IQR) | 6.5% | 2.2% |
| Standard Deviation (Sample) | 4.9% | 4.3% |
| Standard Deviation (Population) | 4.9% | 4.3% |
Similar Demographics by Disability
Demographics Similar to Cajuns by Disability
In terms of disability, the demographic groups most similar to Cajuns are Yuman (14.6%, a difference of 0.12%), Pueblo (14.4%, a difference of 1.1%), Alaskan Athabascan (14.4%, a difference of 1.1%), Tohono O'odham (14.8%, a difference of 1.2%), and Cherokee (14.8%, a difference of 1.7%).
| Demographics | Rating | Rank | Disability |
| Osage | 0.0 /100 | #326 | Tragic 14.2% |
| Ottawa | 0.0 /100 | #327 | Tragic 14.2% |
| Immigrants | Azores | 0.0 /100 | #328 | Tragic 14.2% |
| Potawatomi | 0.0 /100 | #329 | Tragic 14.2% |
| Navajo | 0.0 /100 | #330 | Tragic 14.3% |
| Alaskan Athabascans | 0.0 /100 | #331 | Tragic 14.4% |
| Pueblo | 0.0 /100 | #332 | Tragic 14.4% |
| Cajuns | 0.0 /100 | #333 | Tragic 14.6% |
| Yuman | 0.0 /100 | #334 | Tragic 14.6% |
| Tohono O'odham | 0.0 /100 | #335 | Tragic 14.8% |
| Cherokee | 0.0 /100 | #336 | Tragic 14.8% |
| Seminole | 0.0 /100 | #337 | Tragic 14.9% |
| Dutch West Indians | 0.0 /100 | #338 | Tragic 14.9% |
| Chickasaw | 0.0 /100 | #339 | Tragic 15.2% |
| Choctaw | 0.0 /100 | #340 | Tragic 15.4% |
Demographics Similar to Immigrants from Laos by Disability
In terms of disability, the demographic groups most similar to Immigrants from Laos are Immigrants from Dominica (12.4%, a difference of 0.090%), Slavic (12.4%, a difference of 0.14%), Slovene (12.4%, a difference of 0.16%), Canadian (12.4%, a difference of 0.20%), and Immigrants from Liberia (12.4%, a difference of 0.23%).
| Demographics | Rating | Rank | Disability |
| Sub-Saharan Africans | 1.4 /100 | #250 | Tragic 12.3% |
| Europeans | 1.4 /100 | #251 | Tragic 12.3% |
| Bermudans | 1.1 /100 | #252 | Tragic 12.3% |
| Belgians | 0.8 /100 | #253 | Tragic 12.3% |
| German Russians | 0.8 /100 | #254 | Tragic 12.3% |
| Slovenes | 0.6 /100 | #255 | Tragic 12.4% |
| Immigrants | Dominica | 0.6 /100 | #256 | Tragic 12.4% |
| Immigrants | Laos | 0.5 /100 | #257 | Tragic 12.4% |
| Slavs | 0.5 /100 | #258 | Tragic 12.4% |
| Canadians | 0.4 /100 | #259 | Tragic 12.4% |
| Immigrants | Liberia | 0.4 /100 | #260 | Tragic 12.4% |
| Scandinavians | 0.4 /100 | #261 | Tragic 12.4% |
| Native Hawaiians | 0.3 /100 | #262 | Tragic 12.5% |
| Hawaiians | 0.2 /100 | #263 | Tragic 12.5% |
| Immigrants | Germany | 0.2 /100 | #264 | Tragic 12.5% |