Cajun vs Cherokee Disability
COMPARE
Cajun
Cherokee
Disability
Disability Comparison
Cajuns
Cherokee
14.6%
DISABILITY
0.0/ 100
METRIC RATING
333rd/ 347
METRIC RANK
14.8%
DISABILITY
0.0/ 100
METRIC RATING
336th/ 347
METRIC RANK
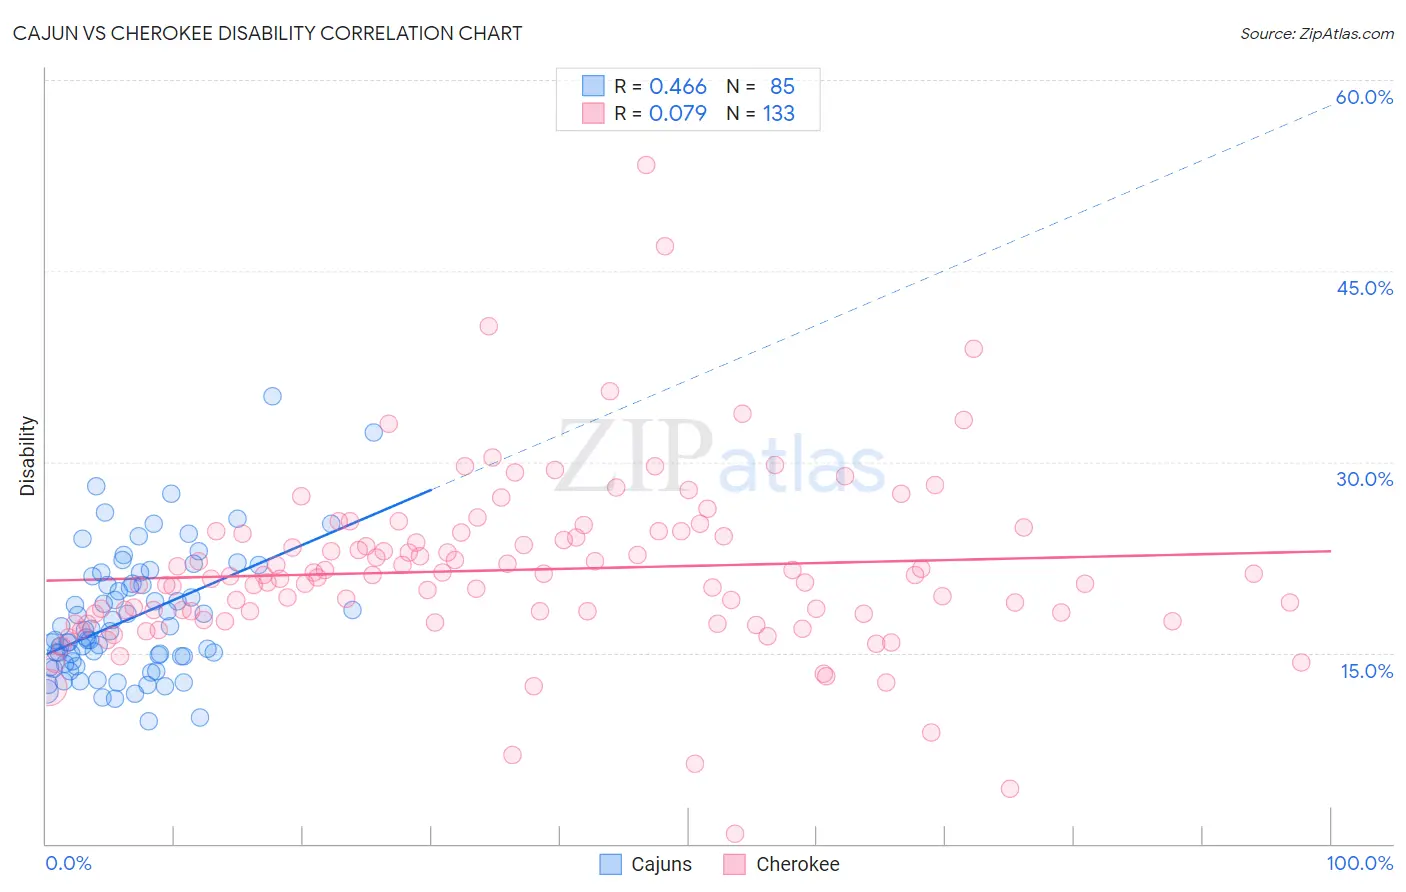
Cajun vs Cherokee Disability Correlation Chart
The statistical analysis conducted on geographies consisting of 149,702,868 people shows a moderate positive correlation between the proportion of Cajuns and percentage of population with a disability in the United States with a correlation coefficient (R) of 0.466 and weighted average of 14.6%. Similarly, the statistical analysis conducted on geographies consisting of 493,590,600 people shows a slight positive correlation between the proportion of Cherokee and percentage of population with a disability in the United States with a correlation coefficient (R) of 0.079 and weighted average of 14.8%, a difference of 1.7%.
Disability Correlation Summary
| Measurement | Cajun | Cherokee |
| Minimum | 9.6% | 0.80% |
| Maximum | 35.2% | 53.3% |
| Range | 25.5% | 52.5% |
| Mean | 17.8% | 21.5% |
| Median | 16.7% | 21.0% |
| Interquartile 25% (IQ1) | 14.3% | 18.0% |
| Interquartile 75% (IQ3) | 20.7% | 24.4% |
| Interquartile Range (IQR) | 6.5% | 6.4% |
| Standard Deviation (Sample) | 4.9% | 6.9% |
| Standard Deviation (Population) | 4.9% | 6.9% |
Demographics Similar to Cajuns and Cherokee by Disability
In terms of disability, the demographic groups most similar to Cajuns are Yuman (14.6%, a difference of 0.12%), Pueblo (14.4%, a difference of 1.1%), Alaskan Athabascan (14.4%, a difference of 1.1%), Tohono O'odham (14.8%, a difference of 1.2%), and Seminole (14.9%, a difference of 1.8%). Similarly, the demographic groups most similar to Cherokee are Seminole (14.9%, a difference of 0.090%), Dutch West Indian (14.9%, a difference of 0.39%), Tohono O'odham (14.8%, a difference of 0.51%), Yuman (14.6%, a difference of 1.5%), and Chickasaw (15.2%, a difference of 2.2%).
| Demographics | Rating | Rank | Disability |
| Chippewa | 0.0 /100 | #324 | Tragic 14.1% |
| Natives/Alaskans | 0.0 /100 | #325 | Tragic 14.2% |
| Osage | 0.0 /100 | #326 | Tragic 14.2% |
| Ottawa | 0.0 /100 | #327 | Tragic 14.2% |
| Immigrants | Azores | 0.0 /100 | #328 | Tragic 14.2% |
| Potawatomi | 0.0 /100 | #329 | Tragic 14.2% |
| Navajo | 0.0 /100 | #330 | Tragic 14.3% |
| Alaskan Athabascans | 0.0 /100 | #331 | Tragic 14.4% |
| Pueblo | 0.0 /100 | #332 | Tragic 14.4% |
| Cajuns | 0.0 /100 | #333 | Tragic 14.6% |
| Yuman | 0.0 /100 | #334 | Tragic 14.6% |
| Tohono O'odham | 0.0 /100 | #335 | Tragic 14.8% |
| Cherokee | 0.0 /100 | #336 | Tragic 14.8% |
| Seminole | 0.0 /100 | #337 | Tragic 14.9% |
| Dutch West Indians | 0.0 /100 | #338 | Tragic 14.9% |
| Chickasaw | 0.0 /100 | #339 | Tragic 15.2% |
| Choctaw | 0.0 /100 | #340 | Tragic 15.4% |
| Lumbee | 0.0 /100 | #341 | Tragic 15.5% |
| Kiowa | 0.0 /100 | #342 | Tragic 15.6% |
| Creek | 0.0 /100 | #343 | Tragic 15.6% |
| Colville | 0.0 /100 | #344 | Tragic 15.8% |