Cajun vs Immigrants from Cameroon Disability
COMPARE
Cajun
Immigrants from Cameroon
Disability
Disability Comparison
Cajuns
Immigrants from Cameroon
14.6%
DISABILITY
0.0/ 100
METRIC RATING
333rd/ 347
METRIC RANK
11.1%
DISABILITY
99.3/ 100
METRIC RATING
78th/ 347
METRIC RANK
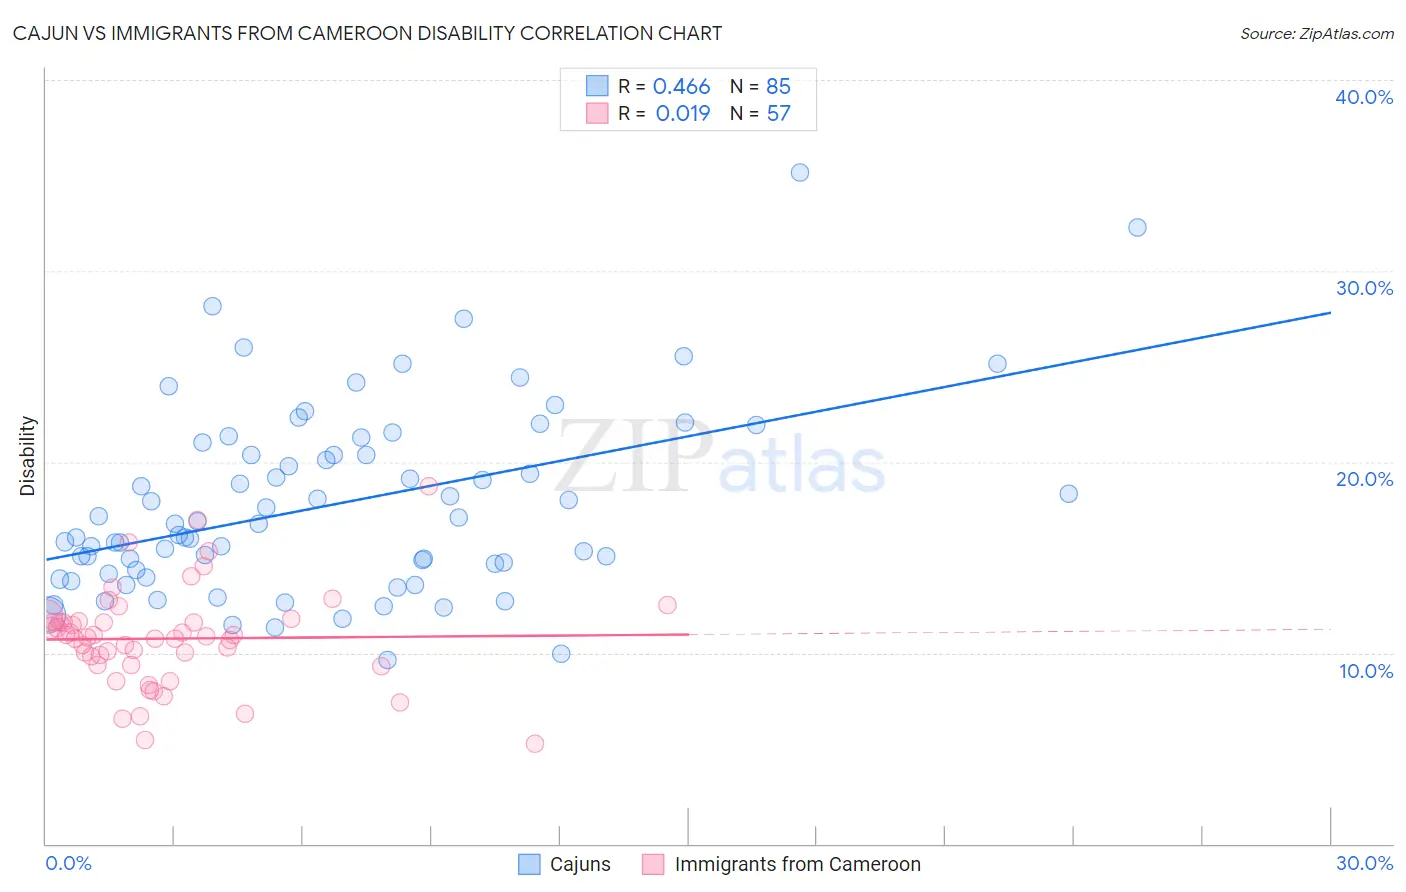
Cajun vs Immigrants from Cameroon Disability Correlation Chart
The statistical analysis conducted on geographies consisting of 149,702,868 people shows a moderate positive correlation between the proportion of Cajuns and percentage of population with a disability in the United States with a correlation coefficient (R) of 0.466 and weighted average of 14.6%. Similarly, the statistical analysis conducted on geographies consisting of 130,761,235 people shows no correlation between the proportion of Immigrants from Cameroon and percentage of population with a disability in the United States with a correlation coefficient (R) of 0.019 and weighted average of 11.1%, a difference of 32.1%.
Disability Correlation Summary
| Measurement | Cajun | Immigrants from Cameroon |
| Minimum | 9.6% | 5.2% |
| Maximum | 35.2% | 18.7% |
| Range | 25.5% | 13.5% |
| Mean | 17.8% | 10.7% |
| Median | 16.7% | 10.8% |
| Interquartile 25% (IQ1) | 14.3% | 9.4% |
| Interquartile 75% (IQ3) | 20.7% | 11.6% |
| Interquartile Range (IQR) | 6.5% | 2.3% |
| Standard Deviation (Sample) | 4.9% | 2.6% |
| Standard Deviation (Population) | 4.9% | 2.6% |
Similar Demographics by Disability
Demographics Similar to Cajuns by Disability
In terms of disability, the demographic groups most similar to Cajuns are Yuman (14.6%, a difference of 0.12%), Pueblo (14.4%, a difference of 1.1%), Alaskan Athabascan (14.4%, a difference of 1.1%), Tohono O'odham (14.8%, a difference of 1.2%), and Cherokee (14.8%, a difference of 1.7%).
| Demographics | Rating | Rank | Disability |
| Osage | 0.0 /100 | #326 | Tragic 14.2% |
| Ottawa | 0.0 /100 | #327 | Tragic 14.2% |
| Immigrants | Azores | 0.0 /100 | #328 | Tragic 14.2% |
| Potawatomi | 0.0 /100 | #329 | Tragic 14.2% |
| Navajo | 0.0 /100 | #330 | Tragic 14.3% |
| Alaskan Athabascans | 0.0 /100 | #331 | Tragic 14.4% |
| Pueblo | 0.0 /100 | #332 | Tragic 14.4% |
| Cajuns | 0.0 /100 | #333 | Tragic 14.6% |
| Yuman | 0.0 /100 | #334 | Tragic 14.6% |
| Tohono O'odham | 0.0 /100 | #335 | Tragic 14.8% |
| Cherokee | 0.0 /100 | #336 | Tragic 14.8% |
| Seminole | 0.0 /100 | #337 | Tragic 14.9% |
| Dutch West Indians | 0.0 /100 | #338 | Tragic 14.9% |
| Chickasaw | 0.0 /100 | #339 | Tragic 15.2% |
| Choctaw | 0.0 /100 | #340 | Tragic 15.4% |
Demographics Similar to Immigrants from Cameroon by Disability
In terms of disability, the demographic groups most similar to Immigrants from Cameroon are Sierra Leonean (11.0%, a difference of 0.040%), Immigrants from Belgium (11.0%, a difference of 0.040%), Immigrants from Jordan (11.1%, a difference of 0.040%), Immigrants from Vietnam (11.0%, a difference of 0.070%), and Immigrants from Ireland (11.1%, a difference of 0.080%).
| Demographics | Rating | Rank | Disability |
| Immigrants | Lebanon | 99.4 /100 | #71 | Exceptional 11.0% |
| Immigrants | Chile | 99.4 /100 | #72 | Exceptional 11.0% |
| Immigrants | Bangladesh | 99.4 /100 | #73 | Exceptional 11.0% |
| Immigrants | Serbia | 99.4 /100 | #74 | Exceptional 11.0% |
| Immigrants | Vietnam | 99.4 /100 | #75 | Exceptional 11.0% |
| Sierra Leoneans | 99.3 /100 | #76 | Exceptional 11.0% |
| Immigrants | Belgium | 99.3 /100 | #77 | Exceptional 11.0% |
| Immigrants | Cameroon | 99.3 /100 | #78 | Exceptional 11.1% |
| Immigrants | Jordan | 99.3 /100 | #79 | Exceptional 11.1% |
| Immigrants | Ireland | 99.3 /100 | #80 | Exceptional 11.1% |
| Immigrants | Poland | 99.1 /100 | #81 | Exceptional 11.1% |
| Chileans | 99.1 /100 | #82 | Exceptional 11.1% |
| Immigrants | Switzerland | 99.0 /100 | #83 | Exceptional 11.1% |
| Immigrants | Sierra Leone | 99.0 /100 | #84 | Exceptional 11.1% |
| Immigrants | Belarus | 98.9 /100 | #85 | Exceptional 11.1% |