Cajun vs Shoshone Disability Age 65 to 74
COMPARE
Cajun
Shoshone
Disability Age 65 to 74
Disability Age 65 to 74 Comparison
Cajuns
Shoshone
27.9%
DISABILITY AGE 65 TO 74
0.0/ 100
METRIC RATING
315th/ 347
METRIC RANK
27.4%
DISABILITY AGE 65 TO 74
0.0/ 100
METRIC RATING
310th/ 347
METRIC RANK
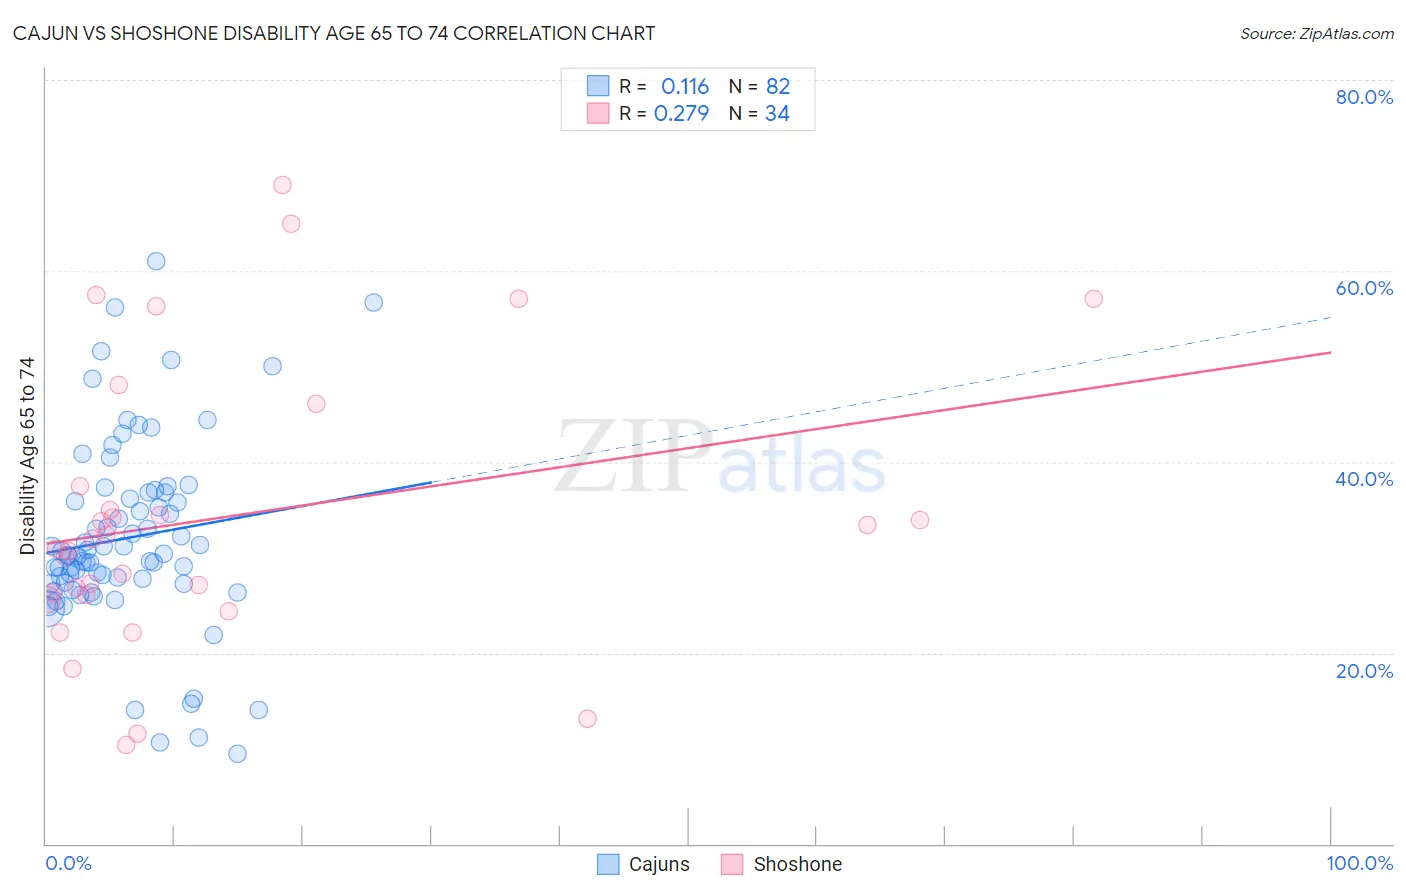
Cajun vs Shoshone Disability Age 65 to 74 Correlation Chart
The statistical analysis conducted on geographies consisting of 149,600,778 people shows a poor positive correlation between the proportion of Cajuns and percentage of population with a disability between the ages 65 and 75 in the United States with a correlation coefficient (R) of 0.116 and weighted average of 27.9%. Similarly, the statistical analysis conducted on geographies consisting of 66,592,892 people shows a weak positive correlation between the proportion of Shoshone and percentage of population with a disability between the ages 65 and 75 in the United States with a correlation coefficient (R) of 0.279 and weighted average of 27.4%, a difference of 2.0%.
Disability Age 65 to 74 Correlation Summary
| Measurement | Cajun | Shoshone |
| Minimum | 9.5% | 10.3% |
| Maximum | 61.0% | 69.0% |
| Range | 51.5% | 58.7% |
| Mean | 32.0% | 34.2% |
| Median | 30.3% | 31.4% |
| Interquartile 25% (IQ1) | 27.3% | 26.0% |
| Interquartile 75% (IQ3) | 36.8% | 37.5% |
| Interquartile Range (IQR) | 9.5% | 11.5% |
| Standard Deviation (Sample) | 9.9% | 14.8% |
| Standard Deviation (Population) | 9.9% | 14.6% |
Demographics Similar to Cajuns and Shoshone by Disability Age 65 to 74
In terms of disability age 65 to 74, the demographic groups most similar to Cajuns are Crow (27.9%, a difference of 0.040%), Immigrants from Armenia (28.0%, a difference of 0.13%), Nepalese (28.0%, a difference of 0.35%), Chippewa (27.8%, a difference of 0.47%), and Paiute (27.8%, a difference of 0.48%). Similarly, the demographic groups most similar to Shoshone are Yaqui (27.4%, a difference of 0.050%), Sioux (27.3%, a difference of 0.11%), Menominee (27.4%, a difference of 0.23%), Ute (27.3%, a difference of 0.26%), and Osage (27.5%, a difference of 0.30%).
| Demographics | Rating | Rank | Disability Age 65 to 74 |
| Central American Indians | 0.0 /100 | #302 | Tragic 27.1% |
| Tlingit-Haida | 0.0 /100 | #303 | Tragic 27.1% |
| Puget Sound Salish | 0.0 /100 | #304 | Tragic 27.2% |
| Mexicans | 0.0 /100 | #305 | Tragic 27.2% |
| Blacks/African Americans | 0.0 /100 | #306 | Tragic 27.3% |
| Ute | 0.0 /100 | #307 | Tragic 27.3% |
| Sioux | 0.0 /100 | #308 | Tragic 27.3% |
| Yaqui | 0.0 /100 | #309 | Tragic 27.4% |
| Shoshone | 0.0 /100 | #310 | Tragic 27.4% |
| Menominee | 0.0 /100 | #311 | Tragic 27.4% |
| Osage | 0.0 /100 | #312 | Tragic 27.5% |
| Paiute | 0.0 /100 | #313 | Tragic 27.8% |
| Chippewa | 0.0 /100 | #314 | Tragic 27.8% |
| Cajuns | 0.0 /100 | #315 | Tragic 27.9% |
| Crow | 0.0 /100 | #316 | Tragic 27.9% |
| Immigrants | Armenia | 0.0 /100 | #317 | Tragic 28.0% |
| Nepalese | 0.0 /100 | #318 | Tragic 28.0% |
| Arapaho | 0.0 /100 | #319 | Tragic 28.1% |
| Cherokee | 0.0 /100 | #320 | Tragic 28.2% |
| Comanche | 0.0 /100 | #321 | Tragic 28.3% |
| Aleuts | 0.0 /100 | #322 | Tragic 28.4% |