Egyptian vs Bermudan Self-Care Disability
COMPARE
Egyptian
Bermudan
Self-Care Disability
Self-Care Disability Comparison
Egyptians
Bermudans
2.3%
SELF-CARE DISABILITY
99.4/ 100
METRIC RATING
62nd/ 347
METRIC RANK
2.6%
SELF-CARE DISABILITY
1.9/ 100
METRIC RATING
236th/ 347
METRIC RANK
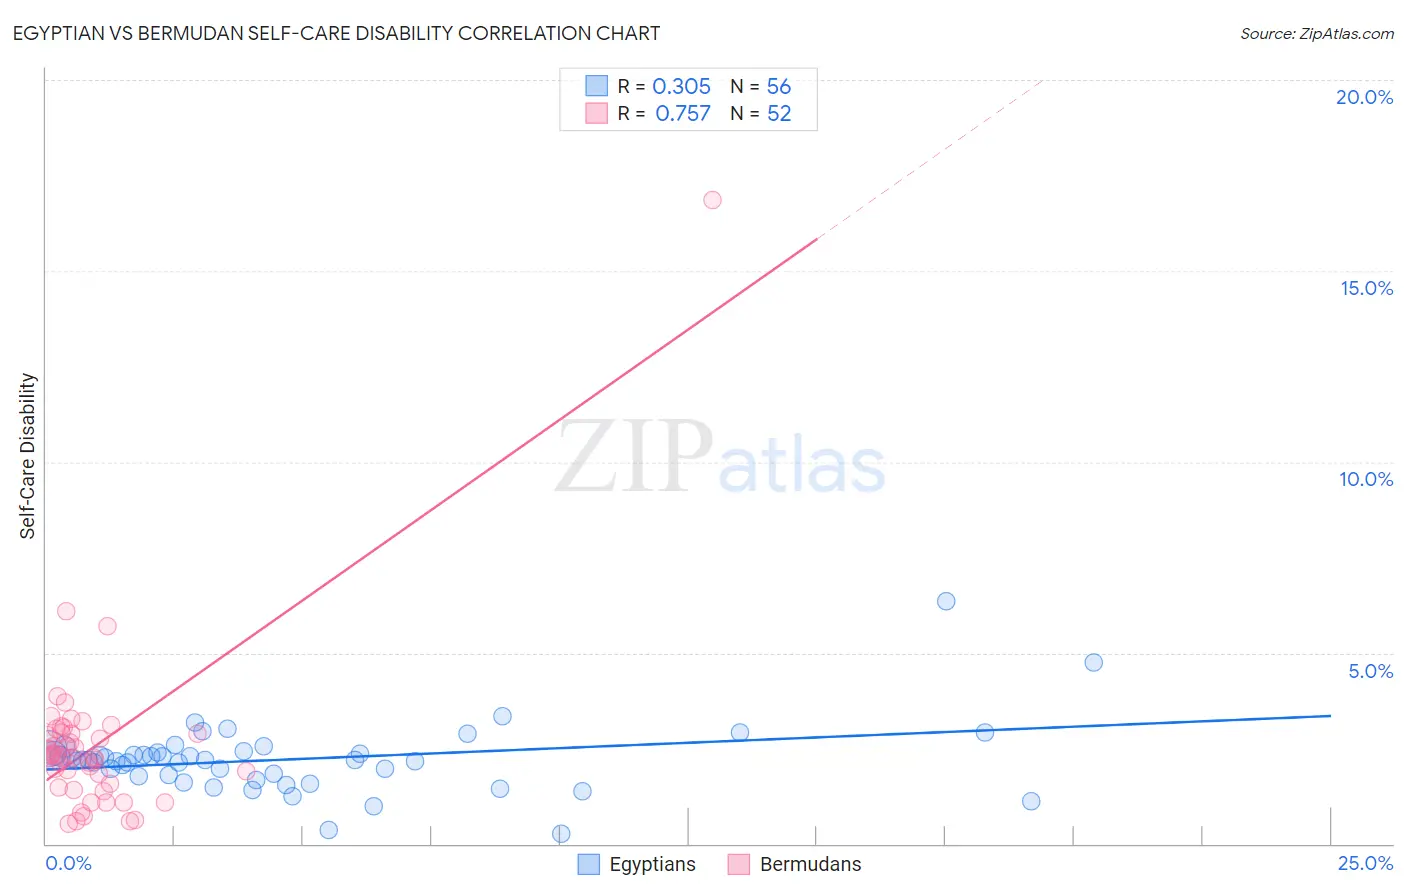
Egyptian vs Bermudan Self-Care Disability Correlation Chart
The statistical analysis conducted on geographies consisting of 276,732,950 people shows a mild positive correlation between the proportion of Egyptians and percentage of population with self-care disability in the United States with a correlation coefficient (R) of 0.305 and weighted average of 2.3%. Similarly, the statistical analysis conducted on geographies consisting of 55,721,549 people shows a strong positive correlation between the proportion of Bermudans and percentage of population with self-care disability in the United States with a correlation coefficient (R) of 0.757 and weighted average of 2.6%, a difference of 11.5%.
Self-Care Disability Correlation Summary
| Measurement | Egyptian | Bermudan |
| Minimum | 0.26% | 0.52% |
| Maximum | 6.4% | 16.9% |
| Range | 6.1% | 16.3% |
| Mean | 2.2% | 2.6% |
| Median | 2.2% | 2.3% |
| Interquartile 25% (IQ1) | 1.8% | 1.5% |
| Interquartile 75% (IQ3) | 2.4% | 2.9% |
| Interquartile Range (IQR) | 0.61% | 1.4% |
| Standard Deviation (Sample) | 0.90% | 2.3% |
| Standard Deviation (Population) | 0.89% | 2.3% |
Similar Demographics by Self-Care Disability
Demographics Similar to Egyptians by Self-Care Disability
In terms of self-care disability, the demographic groups most similar to Egyptians are Palestinian (2.3%, a difference of 0.090%), Mongolian (2.3%, a difference of 0.090%), Swedish (2.3%, a difference of 0.090%), Brazilian (2.3%, a difference of 0.16%), and Immigrants from Japan (2.3%, a difference of 0.19%).
| Demographics | Rating | Rank | Self-Care Disability |
| Immigrants | France | 99.6 /100 | #55 | Exceptional 2.3% |
| Immigrants | Eastern Asia | 99.6 /100 | #56 | Exceptional 2.3% |
| Immigrants | Belgium | 99.6 /100 | #57 | Exceptional 2.3% |
| Immigrants | Cameroon | 99.6 /100 | #58 | Exceptional 2.3% |
| New Zealanders | 99.5 /100 | #59 | Exceptional 2.3% |
| Immigrants | Japan | 99.5 /100 | #60 | Exceptional 2.3% |
| Palestinians | 99.4 /100 | #61 | Exceptional 2.3% |
| Egyptians | 99.4 /100 | #62 | Exceptional 2.3% |
| Mongolians | 99.3 /100 | #63 | Exceptional 2.3% |
| Swedes | 99.3 /100 | #64 | Exceptional 2.3% |
| Brazilians | 99.3 /100 | #65 | Exceptional 2.3% |
| Immigrants | Argentina | 99.3 /100 | #66 | Exceptional 2.3% |
| South Africans | 99.3 /100 | #67 | Exceptional 2.3% |
| Immigrants | Zaire | 99.2 /100 | #68 | Exceptional 2.3% |
| Immigrants | Norway | 99.2 /100 | #69 | Exceptional 2.3% |
Demographics Similar to Bermudans by Self-Care Disability
In terms of self-care disability, the demographic groups most similar to Bermudans are Bahamian (2.6%, a difference of 0.070%), Vietnamese (2.6%, a difference of 0.10%), Liberian (2.6%, a difference of 0.11%), Albanian (2.6%, a difference of 0.15%), and Immigrants from Guatemala (2.6%, a difference of 0.18%).
| Demographics | Rating | Rank | Self-Care Disability |
| Guamanians/Chamorros | 2.5 /100 | #229 | Tragic 2.6% |
| Immigrants | Ecuador | 2.5 /100 | #230 | Tragic 2.6% |
| Immigrants | Guatemala | 2.2 /100 | #231 | Tragic 2.6% |
| Albanians | 2.2 /100 | #232 | Tragic 2.6% |
| Liberians | 2.1 /100 | #233 | Tragic 2.6% |
| Vietnamese | 2.1 /100 | #234 | Tragic 2.6% |
| Bahamians | 2.0 /100 | #235 | Tragic 2.6% |
| Bermudans | 1.9 /100 | #236 | Tragic 2.6% |
| Immigrants | Senegal | 1.6 /100 | #237 | Tragic 2.6% |
| Senegalese | 1.3 /100 | #238 | Tragic 2.6% |
| Immigrants | Panama | 1.2 /100 | #239 | Tragic 2.6% |
| Marshallese | 1.2 /100 | #240 | Tragic 2.6% |
| Immigrants | Syria | 1.0 /100 | #241 | Tragic 2.6% |
| Spanish | 0.8 /100 | #242 | Tragic 2.6% |
| Hawaiians | 0.8 /100 | #243 | Tragic 2.6% |