British vs Bermudan Poverty
COMPARE
British
Bermudan
Poverty
Poverty Comparison
British
Bermudans
11.4%
POVERTY
95.0/ 100
METRIC RATING
92nd/ 347
METRIC RANK
13.3%
POVERTY
3.7/ 100
METRIC RATING
214th/ 347
METRIC RANK
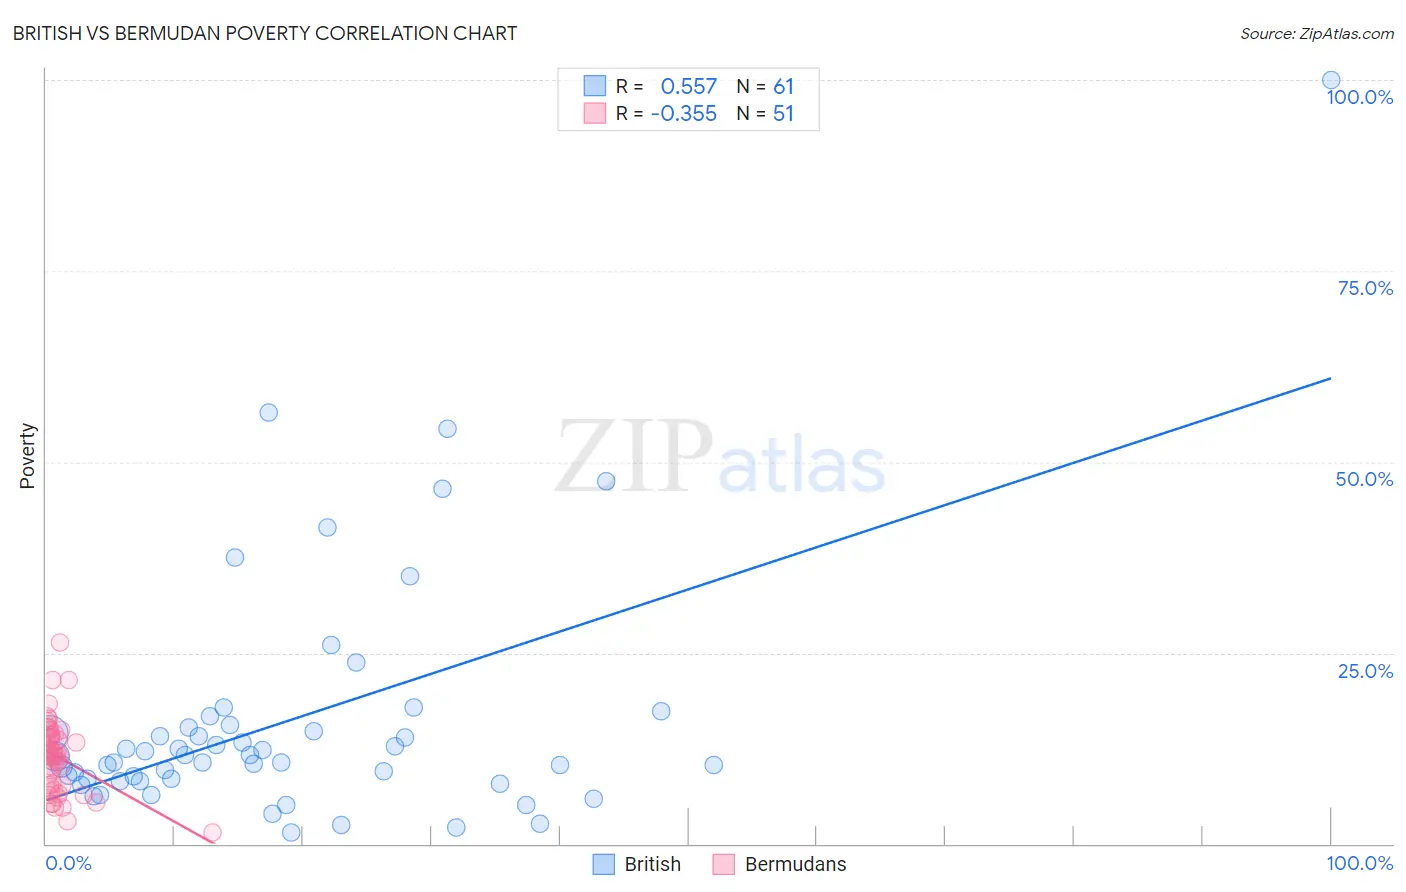
British vs Bermudan Poverty Correlation Chart
The statistical analysis conducted on geographies consisting of 530,938,105 people shows a substantial positive correlation between the proportion of British and poverty level in the United States with a correlation coefficient (R) of 0.557 and weighted average of 11.4%. Similarly, the statistical analysis conducted on geographies consisting of 55,716,155 people shows a mild negative correlation between the proportion of Bermudans and poverty level in the United States with a correlation coefficient (R) of -0.355 and weighted average of 13.3%, a difference of 16.2%.
Poverty Correlation Summary
| Measurement | British | Bermudan |
| Minimum | 1.5% | 1.5% |
| Maximum | 100.0% | 26.3% |
| Range | 98.5% | 24.9% |
| Mean | 16.2% | 11.3% |
| Median | 11.4% | 11.5% |
| Interquartile 25% (IQ1) | 8.4% | 7.0% |
| Interquartile 75% (IQ3) | 15.4% | 14.3% |
| Interquartile Range (IQR) | 7.0% | 7.3% |
| Standard Deviation (Sample) | 16.5% | 4.9% |
| Standard Deviation (Population) | 16.3% | 4.9% |
Similar Demographics by Poverty
Demographics Similar to British by Poverty
In terms of poverty, the demographic groups most similar to British are Romanian (11.4%, a difference of 0.030%), Paraguayan (11.4%, a difference of 0.060%), Australian (11.4%, a difference of 0.060%), Finnish (11.4%, a difference of 0.14%), and Immigrants from South Africa (11.5%, a difference of 0.18%).
| Demographics | Rating | Rank | Poverty |
| Immigrants | England | 96.2 /100 | #85 | Exceptional 11.4% |
| Jordanians | 96.0 /100 | #86 | Exceptional 11.4% |
| Northern Europeans | 96.0 /100 | #87 | Exceptional 11.4% |
| Belgians | 95.8 /100 | #88 | Exceptional 11.4% |
| Czechoslovakians | 95.7 /100 | #89 | Exceptional 11.4% |
| Immigrants | Denmark | 95.5 /100 | #90 | Exceptional 11.4% |
| Finns | 95.2 /100 | #91 | Exceptional 11.4% |
| British | 95.0 /100 | #92 | Exceptional 11.4% |
| Romanians | 94.9 /100 | #93 | Exceptional 11.4% |
| Paraguayans | 94.9 /100 | #94 | Exceptional 11.4% |
| Australians | 94.9 /100 | #95 | Exceptional 11.4% |
| Immigrants | South Africa | 94.7 /100 | #96 | Exceptional 11.5% |
| Immigrants | Egypt | 94.6 /100 | #97 | Exceptional 11.5% |
| Immigrants | Latvia | 94.5 /100 | #98 | Exceptional 11.5% |
| Immigrants | Indonesia | 94.2 /100 | #99 | Exceptional 11.5% |
Demographics Similar to Bermudans by Poverty
In terms of poverty, the demographic groups most similar to Bermudans are Immigrants from Panama (13.3%, a difference of 0.25%), Japanese (13.3%, a difference of 0.26%), Nonimmigrants (13.3%, a difference of 0.26%), Immigrants from Uzbekistan (13.3%, a difference of 0.30%), and Immigrants from Thailand (13.3%, a difference of 0.36%).
| Demographics | Rating | Rank | Poverty |
| Panamanians | 6.6 /100 | #207 | Tragic 13.1% |
| Ugandans | 6.2 /100 | #208 | Tragic 13.1% |
| Malaysians | 6.1 /100 | #209 | Tragic 13.1% |
| Immigrants | Azores | 6.1 /100 | #210 | Tragic 13.1% |
| Moroccans | 5.2 /100 | #211 | Tragic 13.2% |
| Immigrants | Immigrants | 4.3 /100 | #212 | Tragic 13.2% |
| Immigrants | Panama | 4.1 /100 | #213 | Tragic 13.3% |
| Bermudans | 3.7 /100 | #214 | Tragic 13.3% |
| Japanese | 3.3 /100 | #215 | Tragic 13.3% |
| Immigrants | Nonimmigrants | 3.3 /100 | #216 | Tragic 13.3% |
| Immigrants | Uzbekistan | 3.2 /100 | #217 | Tragic 13.3% |
| Immigrants | Thailand | 3.1 /100 | #218 | Tragic 13.3% |
| Immigrants | Cambodia | 3.0 /100 | #219 | Tragic 13.4% |
| Americans | 2.9 /100 | #220 | Tragic 13.4% |
| Alsatians | 2.6 /100 | #221 | Tragic 13.4% |