Slavic vs Bermudan Self-Care Disability
COMPARE
Slavic
Bermudan
Self-Care Disability
Self-Care Disability Comparison
Slavs
Bermudans
2.5%
SELF-CARE DISABILITY
34.3/ 100
METRIC RATING
185th/ 347
METRIC RANK
2.6%
SELF-CARE DISABILITY
1.9/ 100
METRIC RATING
236th/ 347
METRIC RANK
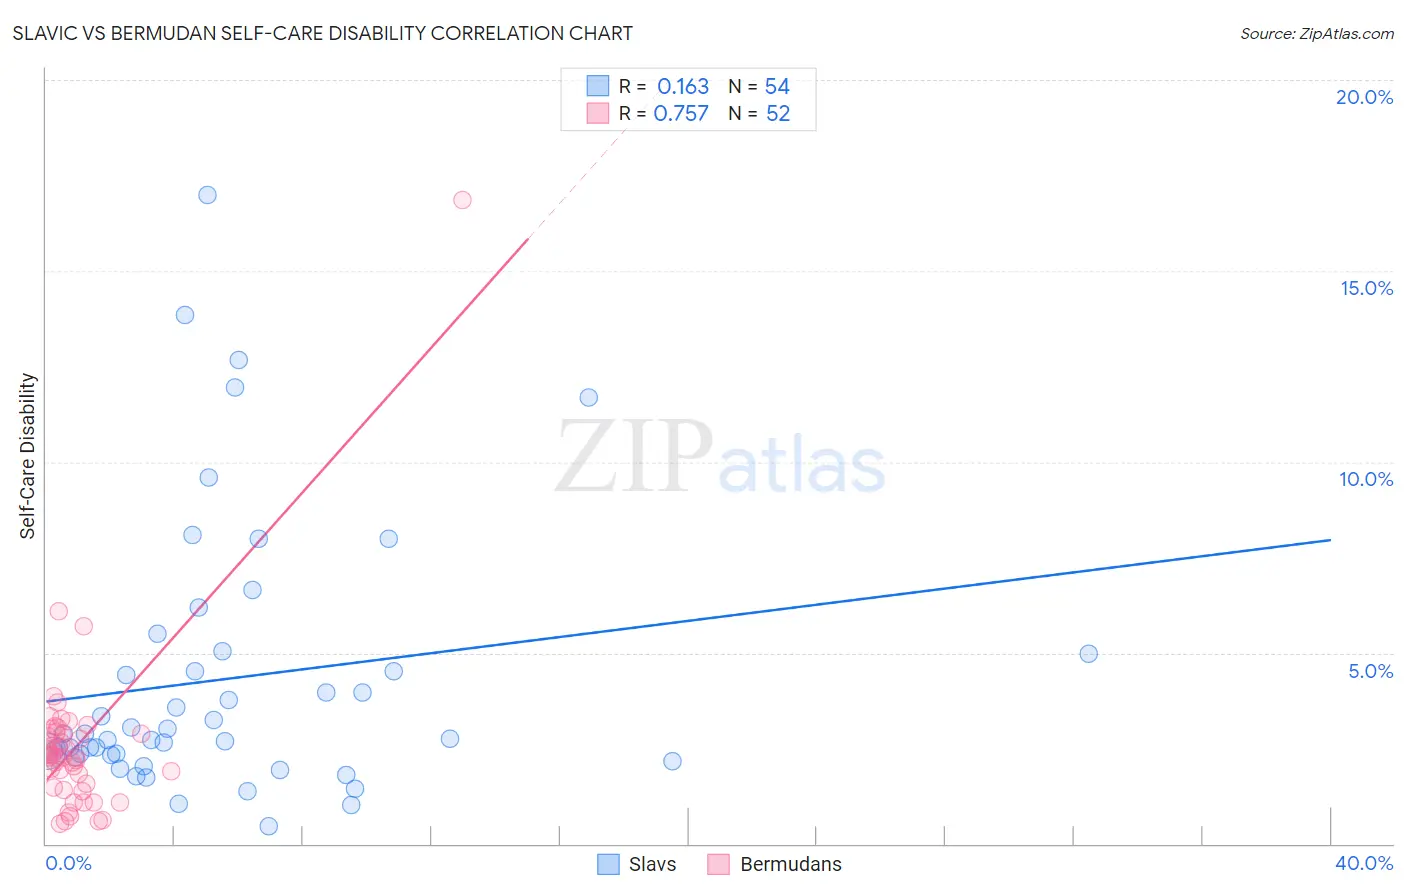
Slavic vs Bermudan Self-Care Disability Correlation Chart
The statistical analysis conducted on geographies consisting of 270,712,233 people shows a poor positive correlation between the proportion of Slavs and percentage of population with self-care disability in the United States with a correlation coefficient (R) of 0.163 and weighted average of 2.5%. Similarly, the statistical analysis conducted on geographies consisting of 55,721,549 people shows a strong positive correlation between the proportion of Bermudans and percentage of population with self-care disability in the United States with a correlation coefficient (R) of 0.757 and weighted average of 2.6%, a difference of 3.9%.
Self-Care Disability Correlation Summary
| Measurement | Slavic | Bermudan |
| Minimum | 0.47% | 0.52% |
| Maximum | 17.0% | 16.9% |
| Range | 16.5% | 16.3% |
| Mean | 4.3% | 2.6% |
| Median | 2.8% | 2.3% |
| Interquartile 25% (IQ1) | 2.3% | 1.5% |
| Interquartile 75% (IQ3) | 5.0% | 2.9% |
| Interquartile Range (IQR) | 2.6% | 1.4% |
| Standard Deviation (Sample) | 3.6% | 2.3% |
| Standard Deviation (Population) | 3.5% | 2.3% |
Similar Demographics by Self-Care Disability
Demographics Similar to Slavs by Self-Care Disability
In terms of self-care disability, the demographic groups most similar to Slavs are Immigrants from El Salvador (2.5%, a difference of 0.070%), Yugoslavian (2.5%, a difference of 0.090%), Salvadoran (2.5%, a difference of 0.11%), Maltese (2.5%, a difference of 0.16%), and Ghanaian (2.5%, a difference of 0.31%).
| Demographics | Rating | Rank | Self-Care Disability |
| English | 46.2 /100 | #178 | Average 2.5% |
| Hungarians | 45.5 /100 | #179 | Average 2.5% |
| Indonesians | 41.2 /100 | #180 | Average 2.5% |
| Ghanaians | 40.4 /100 | #181 | Average 2.5% |
| Maltese | 37.5 /100 | #182 | Fair 2.5% |
| Salvadorans | 36.4 /100 | #183 | Fair 2.5% |
| Yugoslavians | 36.1 /100 | #184 | Fair 2.5% |
| Slavs | 34.3 /100 | #185 | Fair 2.5% |
| Immigrants | El Salvador | 33.0 /100 | #186 | Fair 2.5% |
| Irish | 28.7 /100 | #187 | Fair 2.5% |
| Immigrants | Oceania | 28.3 /100 | #188 | Fair 2.5% |
| Immigrants | Eastern Europe | 28.0 /100 | #189 | Fair 2.5% |
| Sioux | 24.6 /100 | #190 | Fair 2.5% |
| Moroccans | 22.9 /100 | #191 | Fair 2.5% |
| Soviet Union | 22.2 /100 | #192 | Fair 2.5% |
Demographics Similar to Bermudans by Self-Care Disability
In terms of self-care disability, the demographic groups most similar to Bermudans are Bahamian (2.6%, a difference of 0.070%), Vietnamese (2.6%, a difference of 0.10%), Liberian (2.6%, a difference of 0.11%), Albanian (2.6%, a difference of 0.15%), and Immigrants from Guatemala (2.6%, a difference of 0.18%).
| Demographics | Rating | Rank | Self-Care Disability |
| Guamanians/Chamorros | 2.5 /100 | #229 | Tragic 2.6% |
| Immigrants | Ecuador | 2.5 /100 | #230 | Tragic 2.6% |
| Immigrants | Guatemala | 2.2 /100 | #231 | Tragic 2.6% |
| Albanians | 2.2 /100 | #232 | Tragic 2.6% |
| Liberians | 2.1 /100 | #233 | Tragic 2.6% |
| Vietnamese | 2.1 /100 | #234 | Tragic 2.6% |
| Bahamians | 2.0 /100 | #235 | Tragic 2.6% |
| Bermudans | 1.9 /100 | #236 | Tragic 2.6% |
| Immigrants | Senegal | 1.6 /100 | #237 | Tragic 2.6% |
| Senegalese | 1.3 /100 | #238 | Tragic 2.6% |
| Immigrants | Panama | 1.2 /100 | #239 | Tragic 2.6% |
| Marshallese | 1.2 /100 | #240 | Tragic 2.6% |
| Immigrants | Syria | 1.0 /100 | #241 | Tragic 2.6% |
| Spanish | 0.8 /100 | #242 | Tragic 2.6% |
| Hawaiians | 0.8 /100 | #243 | Tragic 2.6% |