British vs Bermudan Master's Degree
COMPARE
British
Bermudan
Master's Degree
Master's Degree Comparison
British
Bermudans
16.4%
MASTER'S DEGREE
95.6/ 100
METRIC RATING
122nd/ 347
METRIC RANK
15.4%
MASTER'S DEGREE
73.9/ 100
METRIC RATING
156th/ 347
METRIC RANK
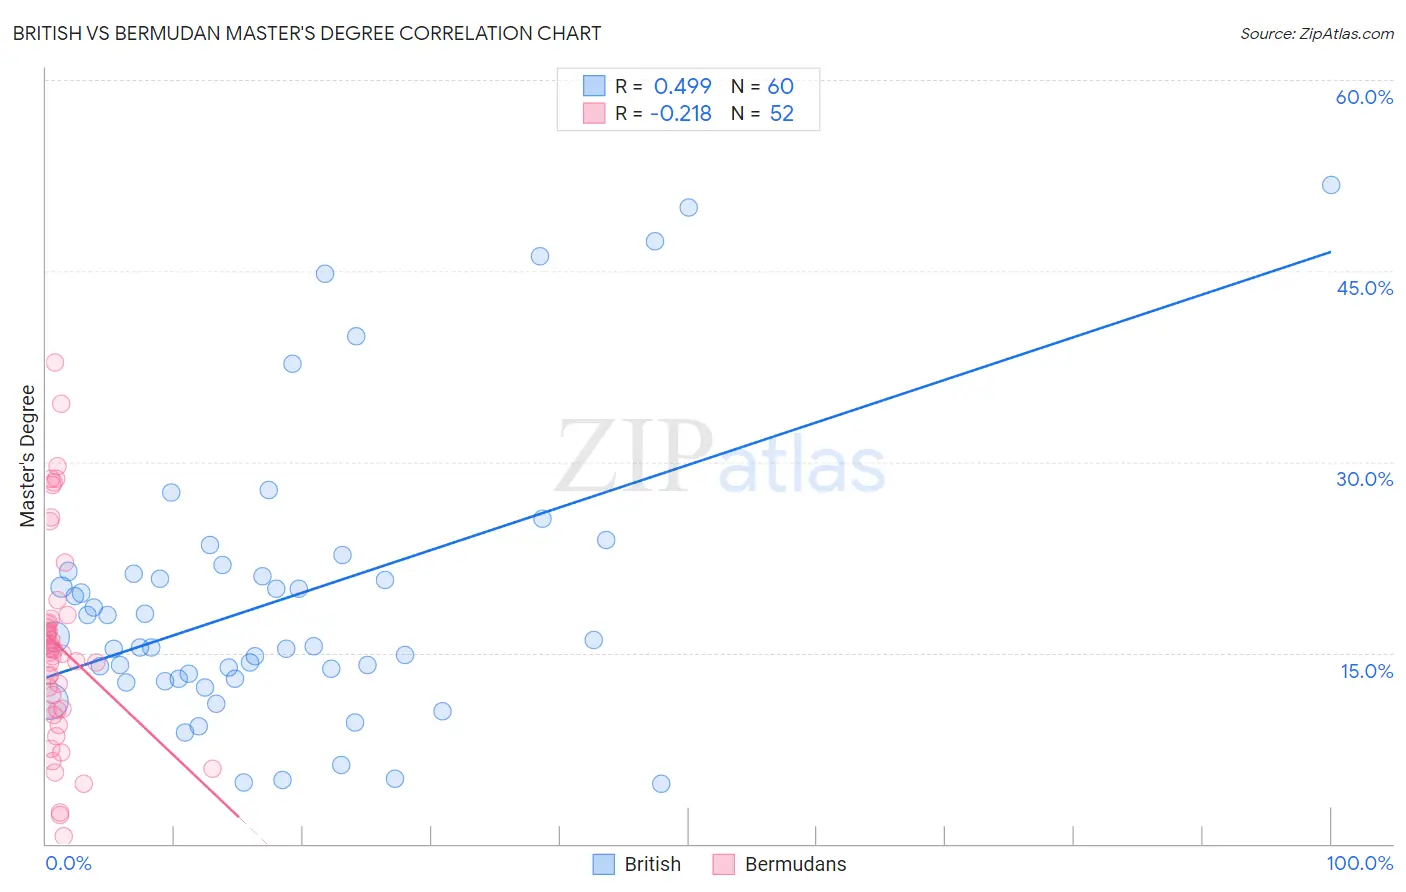
British vs Bermudan Master's Degree Correlation Chart
The statistical analysis conducted on geographies consisting of 531,094,529 people shows a moderate positive correlation between the proportion of British and percentage of population with at least master's degree education in the United States with a correlation coefficient (R) of 0.499 and weighted average of 16.4%. Similarly, the statistical analysis conducted on geographies consisting of 55,727,694 people shows a weak negative correlation between the proportion of Bermudans and percentage of population with at least master's degree education in the United States with a correlation coefficient (R) of -0.218 and weighted average of 15.4%, a difference of 6.3%.
Master's Degree Correlation Summary
| Measurement | British | Bermudan |
| Minimum | 4.8% | 0.60% |
| Maximum | 51.7% | 37.8% |
| Range | 47.0% | 37.2% |
| Mean | 19.2% | 15.5% |
| Median | 15.7% | 15.1% |
| Interquartile 25% (IQ1) | 13.0% | 10.5% |
| Interquartile 75% (IQ3) | 21.3% | 17.5% |
| Interquartile Range (IQR) | 8.4% | 7.0% |
| Standard Deviation (Sample) | 11.1% | 8.1% |
| Standard Deviation (Population) | 11.0% | 8.0% |
Similar Demographics by Master's Degree
Demographics Similar to British by Master's Degree
In terms of master's degree, the demographic groups most similar to British are Croatian (16.4%, a difference of 0.010%), Immigrants from Eritrea (16.4%, a difference of 0.080%), Italian (16.4%, a difference of 0.16%), Immigrants from Eastern Africa (16.3%, a difference of 0.27%), and Afghan (16.5%, a difference of 0.43%).
| Demographics | Rating | Rank | Master's Degree |
| Immigrants | Uganda | 97.3 /100 | #115 | Exceptional 16.6% |
| Immigrants | Southern Europe | 97.2 /100 | #116 | Exceptional 16.6% |
| Immigrants | Moldova | 97.2 /100 | #117 | Exceptional 16.6% |
| Brazilians | 96.8 /100 | #118 | Exceptional 16.5% |
| Jordanians | 96.5 /100 | #119 | Exceptional 16.5% |
| Lebanese | 96.4 /100 | #120 | Exceptional 16.5% |
| Afghans | 96.2 /100 | #121 | Exceptional 16.5% |
| British | 95.6 /100 | #122 | Exceptional 16.4% |
| Croatians | 95.6 /100 | #123 | Exceptional 16.4% |
| Immigrants | Eritrea | 95.5 /100 | #124 | Exceptional 16.4% |
| Italians | 95.4 /100 | #125 | Exceptional 16.4% |
| Immigrants | Eastern Africa | 95.2 /100 | #126 | Exceptional 16.3% |
| Palestinians | 94.8 /100 | #127 | Exceptional 16.3% |
| Immigrants | Sierra Leone | 94.7 /100 | #128 | Exceptional 16.3% |
| Immigrants | Syria | 93.3 /100 | #129 | Exceptional 16.2% |
Demographics Similar to Bermudans by Master's Degree
In terms of master's degree, the demographic groups most similar to Bermudans are Immigrants from Cameroon (15.4%, a difference of 0.35%), Immigrants from Bangladesh (15.5%, a difference of 0.36%), Immigrants from Poland (15.4%, a difference of 0.39%), Immigrants from South America (15.5%, a difference of 0.40%), and Luxembourger (15.3%, a difference of 0.45%).
| Demographics | Rating | Rank | Master's Degree |
| Ghanaians | 78.2 /100 | #149 | Good 15.5% |
| Slovenes | 78.0 /100 | #150 | Good 15.5% |
| Iraqis | 77.3 /100 | #151 | Good 15.5% |
| Slavs | 77.0 /100 | #152 | Good 15.5% |
| Icelanders | 76.8 /100 | #153 | Good 15.5% |
| Immigrants | South America | 76.3 /100 | #154 | Good 15.5% |
| Immigrants | Bangladesh | 76.1 /100 | #155 | Good 15.5% |
| Bermudans | 73.9 /100 | #156 | Good 15.4% |
| Immigrants | Cameroon | 71.7 /100 | #157 | Good 15.4% |
| Immigrants | Poland | 71.5 /100 | #158 | Good 15.4% |
| Luxembourgers | 71.0 /100 | #159 | Good 15.3% |
| Kenyans | 70.3 /100 | #160 | Good 15.3% |
| Sudanese | 68.7 /100 | #161 | Good 15.3% |
| Peruvians | 68.7 /100 | #162 | Good 15.3% |
| Uruguayans | 67.1 /100 | #163 | Good 15.3% |