Marshallese vs Bermudan Self-Care Disability
COMPARE
Marshallese
Bermudan
Self-Care Disability
Self-Care Disability Comparison
Marshallese
Bermudans
2.6%
SELF-CARE DISABILITY
1.2/ 100
METRIC RATING
240th/ 347
METRIC RANK
2.6%
SELF-CARE DISABILITY
1.9/ 100
METRIC RATING
236th/ 347
METRIC RANK
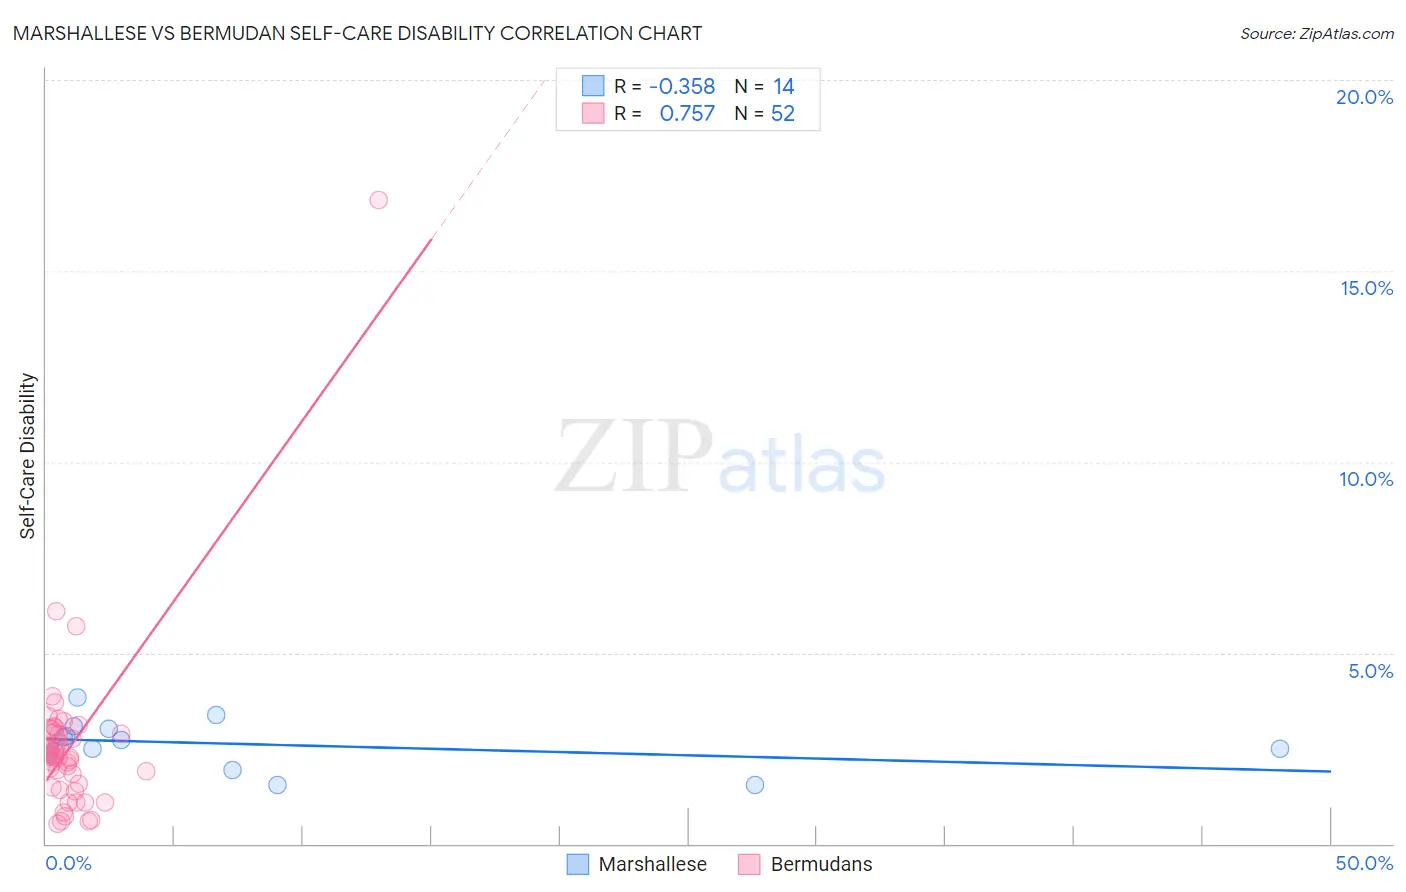
Marshallese vs Bermudan Self-Care Disability Correlation Chart
The statistical analysis conducted on geographies consisting of 14,760,594 people shows a mild negative correlation between the proportion of Marshallese and percentage of population with self-care disability in the United States with a correlation coefficient (R) of -0.358 and weighted average of 2.6%. Similarly, the statistical analysis conducted on geographies consisting of 55,721,549 people shows a strong positive correlation between the proportion of Bermudans and percentage of population with self-care disability in the United States with a correlation coefficient (R) of 0.757 and weighted average of 2.6%, a difference of 0.53%.
Self-Care Disability Correlation Summary
| Measurement | Marshallese | Bermudan |
| Minimum | 1.5% | 0.52% |
| Maximum | 3.8% | 16.9% |
| Range | 2.3% | 16.3% |
| Mean | 2.6% | 2.6% |
| Median | 2.6% | 2.3% |
| Interquartile 25% (IQ1) | 2.4% | 1.5% |
| Interquartile 75% (IQ3) | 3.0% | 2.9% |
| Interquartile Range (IQR) | 0.59% | 1.4% |
| Standard Deviation (Sample) | 0.64% | 2.3% |
| Standard Deviation (Population) | 0.62% | 2.3% |
Demographics Similar to Marshallese and Bermudans by Self-Care Disability
In terms of self-care disability, the demographic groups most similar to Marshallese are Immigrants from Panama (2.6%, a difference of 0.030%), Senegalese (2.6%, a difference of 0.070%), Immigrants from Syria (2.6%, a difference of 0.17%), Immigrants from Senegal (2.6%, a difference of 0.33%), and Spanish (2.6%, a difference of 0.41%). Similarly, the demographic groups most similar to Bermudans are Bahamian (2.6%, a difference of 0.070%), Vietnamese (2.6%, a difference of 0.10%), Liberian (2.6%, a difference of 0.11%), Albanian (2.6%, a difference of 0.15%), and Immigrants from Guatemala (2.6%, a difference of 0.18%).
| Demographics | Rating | Rank | Self-Care Disability |
| Guatemalans | 2.7 /100 | #228 | Tragic 2.6% |
| Guamanians/Chamorros | 2.5 /100 | #229 | Tragic 2.6% |
| Immigrants | Ecuador | 2.5 /100 | #230 | Tragic 2.6% |
| Immigrants | Guatemala | 2.2 /100 | #231 | Tragic 2.6% |
| Albanians | 2.2 /100 | #232 | Tragic 2.6% |
| Liberians | 2.1 /100 | #233 | Tragic 2.6% |
| Vietnamese | 2.1 /100 | #234 | Tragic 2.6% |
| Bahamians | 2.0 /100 | #235 | Tragic 2.6% |
| Bermudans | 1.9 /100 | #236 | Tragic 2.6% |
| Immigrants | Senegal | 1.6 /100 | #237 | Tragic 2.6% |
| Senegalese | 1.3 /100 | #238 | Tragic 2.6% |
| Immigrants | Panama | 1.2 /100 | #239 | Tragic 2.6% |
| Marshallese | 1.2 /100 | #240 | Tragic 2.6% |
| Immigrants | Syria | 1.0 /100 | #241 | Tragic 2.6% |
| Spanish | 0.8 /100 | #242 | Tragic 2.6% |
| Hawaiians | 0.8 /100 | #243 | Tragic 2.6% |
| Yuman | 0.8 /100 | #244 | Tragic 2.6% |
| Immigrants | Western Asia | 0.6 /100 | #245 | Tragic 2.6% |
| Cheyenne | 0.6 /100 | #246 | Tragic 2.6% |
| Immigrants | Albania | 0.6 /100 | #247 | Tragic 2.6% |
| Nicaraguans | 0.6 /100 | #248 | Tragic 2.6% |