Immigrants from Ireland vs Apache Male Disability
COMPARE
Immigrants from Ireland
Apache
Male Disability
Male Disability Comparison
Immigrants from Ireland
Apache
10.6%
MALE DISABILITY
97.9/ 100
METRIC RATING
86th/ 347
METRIC RANK
14.0%
MALE DISABILITY
0.0/ 100
METRIC RATING
322nd/ 347
METRIC RANK
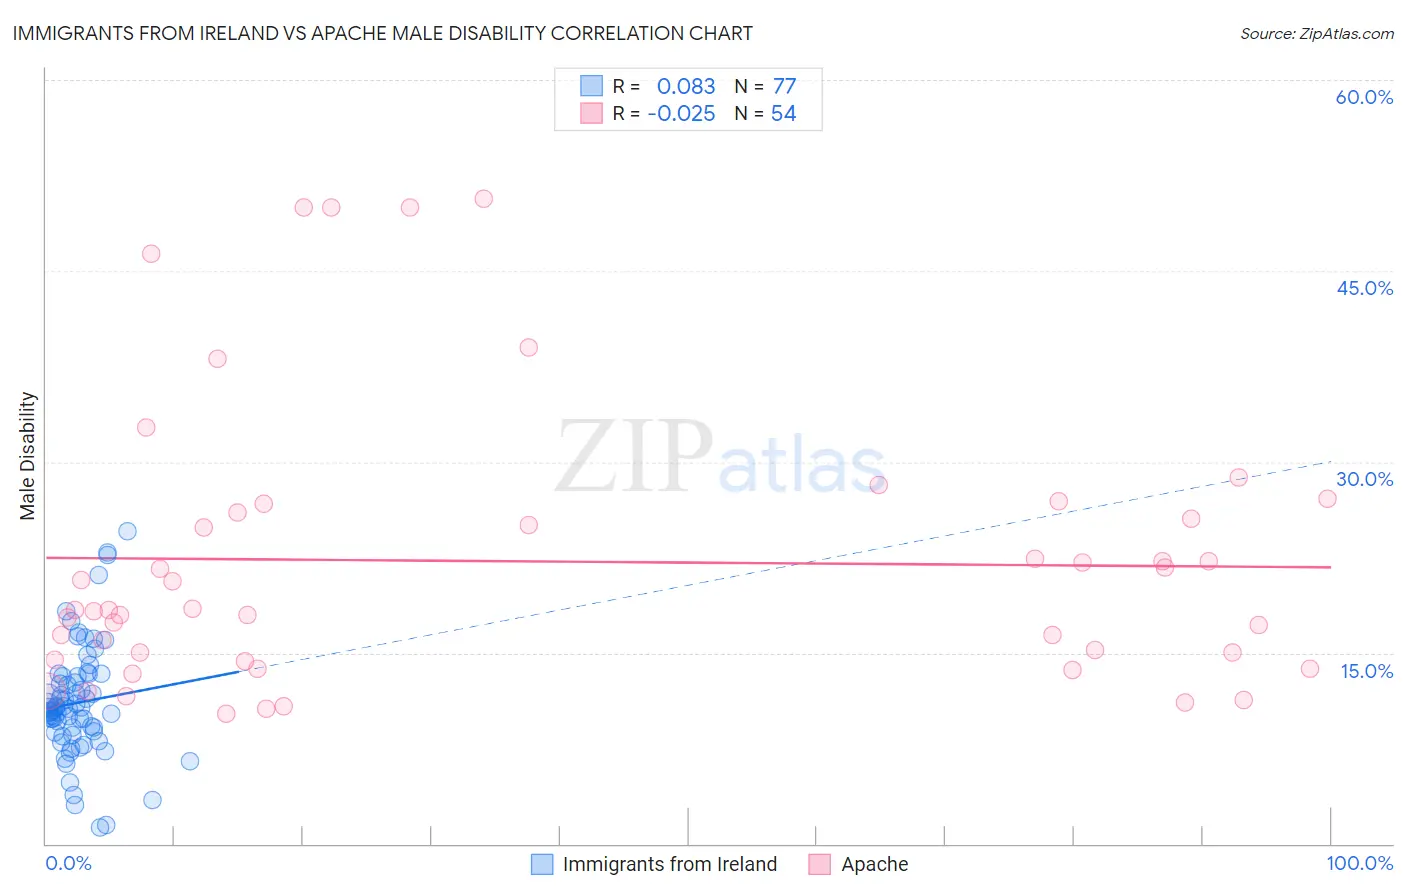
Immigrants from Ireland vs Apache Male Disability Correlation Chart
The statistical analysis conducted on geographies consisting of 240,771,844 people shows a slight positive correlation between the proportion of Immigrants from Ireland and percentage of males with a disability in the United States with a correlation coefficient (R) of 0.083 and weighted average of 10.6%. Similarly, the statistical analysis conducted on geographies consisting of 231,062,399 people shows no correlation between the proportion of Apache and percentage of males with a disability in the United States with a correlation coefficient (R) of -0.025 and weighted average of 14.0%, a difference of 31.8%.
Male Disability Correlation Summary
| Measurement | Immigrants from Ireland | Apache |
| Minimum | 1.3% | 10.2% |
| Maximum | 24.5% | 50.7% |
| Range | 23.2% | 40.5% |
| Mean | 11.1% | 22.2% |
| Median | 10.6% | 18.3% |
| Interquartile 25% (IQ1) | 8.8% | 14.5% |
| Interquartile 75% (IQ3) | 13.2% | 26.0% |
| Interquartile Range (IQR) | 4.4% | 11.6% |
| Standard Deviation (Sample) | 4.4% | 11.0% |
| Standard Deviation (Population) | 4.4% | 10.9% |
Similar Demographics by Male Disability
Demographics Similar to Immigrants from Ireland by Male Disability
In terms of male disability, the demographic groups most similar to Immigrants from Ireland are Sri Lankan (10.6%, a difference of 0.010%), Immigrants from Vietnam (10.6%, a difference of 0.020%), Immigrants from Western Asia (10.6%, a difference of 0.090%), Immigrants from Nicaragua (10.6%, a difference of 0.090%), and Immigrants from Morocco (10.6%, a difference of 0.14%).
| Demographics | Rating | Rank | Male Disability |
| Zimbabweans | 98.4 /100 | #79 | Exceptional 10.6% |
| Immigrants | Jordan | 98.4 /100 | #80 | Exceptional 10.6% |
| Immigrants | Chile | 98.3 /100 | #81 | Exceptional 10.6% |
| Immigrants | Guyana | 98.2 /100 | #82 | Exceptional 10.6% |
| Immigrants | Poland | 98.1 /100 | #83 | Exceptional 10.6% |
| Bulgarians | 98.1 /100 | #84 | Exceptional 10.6% |
| Sri Lankans | 97.9 /100 | #85 | Exceptional 10.6% |
| Immigrants | Ireland | 97.9 /100 | #86 | Exceptional 10.6% |
| Immigrants | Vietnam | 97.9 /100 | #87 | Exceptional 10.6% |
| Immigrants | Western Asia | 97.8 /100 | #88 | Exceptional 10.6% |
| Immigrants | Nicaragua | 97.8 /100 | #89 | Exceptional 10.6% |
| Immigrants | Morocco | 97.7 /100 | #90 | Exceptional 10.6% |
| Immigrants | France | 97.6 /100 | #91 | Exceptional 10.6% |
| Palestinians | 97.4 /100 | #92 | Exceptional 10.7% |
| Immigrants | St. Vincent and the Grenadines | 97.1 /100 | #93 | Exceptional 10.7% |
Demographics Similar to Apache by Male Disability
In terms of male disability, the demographic groups most similar to Apache are Osage (14.0%, a difference of 0.070%), Comanche (14.1%, a difference of 0.40%), Ottawa (14.1%, a difference of 0.51%), Shoshone (13.8%, a difference of 1.1%), and Tlingit-Haida (13.8%, a difference of 1.2%).
| Demographics | Rating | Rank | Male Disability |
| Iroquois | 0.0 /100 | #315 | Tragic 13.6% |
| Alaska Natives | 0.0 /100 | #316 | Tragic 13.6% |
| Paiute | 0.0 /100 | #317 | Tragic 13.7% |
| Cree | 0.0 /100 | #318 | Tragic 13.7% |
| Americans | 0.0 /100 | #319 | Tragic 13.8% |
| Tlingit-Haida | 0.0 /100 | #320 | Tragic 13.8% |
| Shoshone | 0.0 /100 | #321 | Tragic 13.8% |
| Apache | 0.0 /100 | #322 | Tragic 14.0% |
| Osage | 0.0 /100 | #323 | Tragic 14.0% |
| Comanche | 0.0 /100 | #324 | Tragic 14.1% |
| Ottawa | 0.0 /100 | #325 | Tragic 14.1% |
| Natives/Alaskans | 0.0 /100 | #326 | Tragic 14.2% |
| Potawatomi | 0.0 /100 | #327 | Tragic 14.2% |
| Chippewa | 0.0 /100 | #328 | Tragic 14.3% |
| Cajuns | 0.0 /100 | #329 | Tragic 14.4% |