Native Hawaiian vs Apache Male Disability
COMPARE
Native Hawaiian
Apache
Male Disability
Male Disability Comparison
Native Hawaiians
Apache
12.5%
MALE DISABILITY
0.0/ 100
METRIC RATING
273rd/ 347
METRIC RANK
14.0%
MALE DISABILITY
0.0/ 100
METRIC RATING
322nd/ 347
METRIC RANK
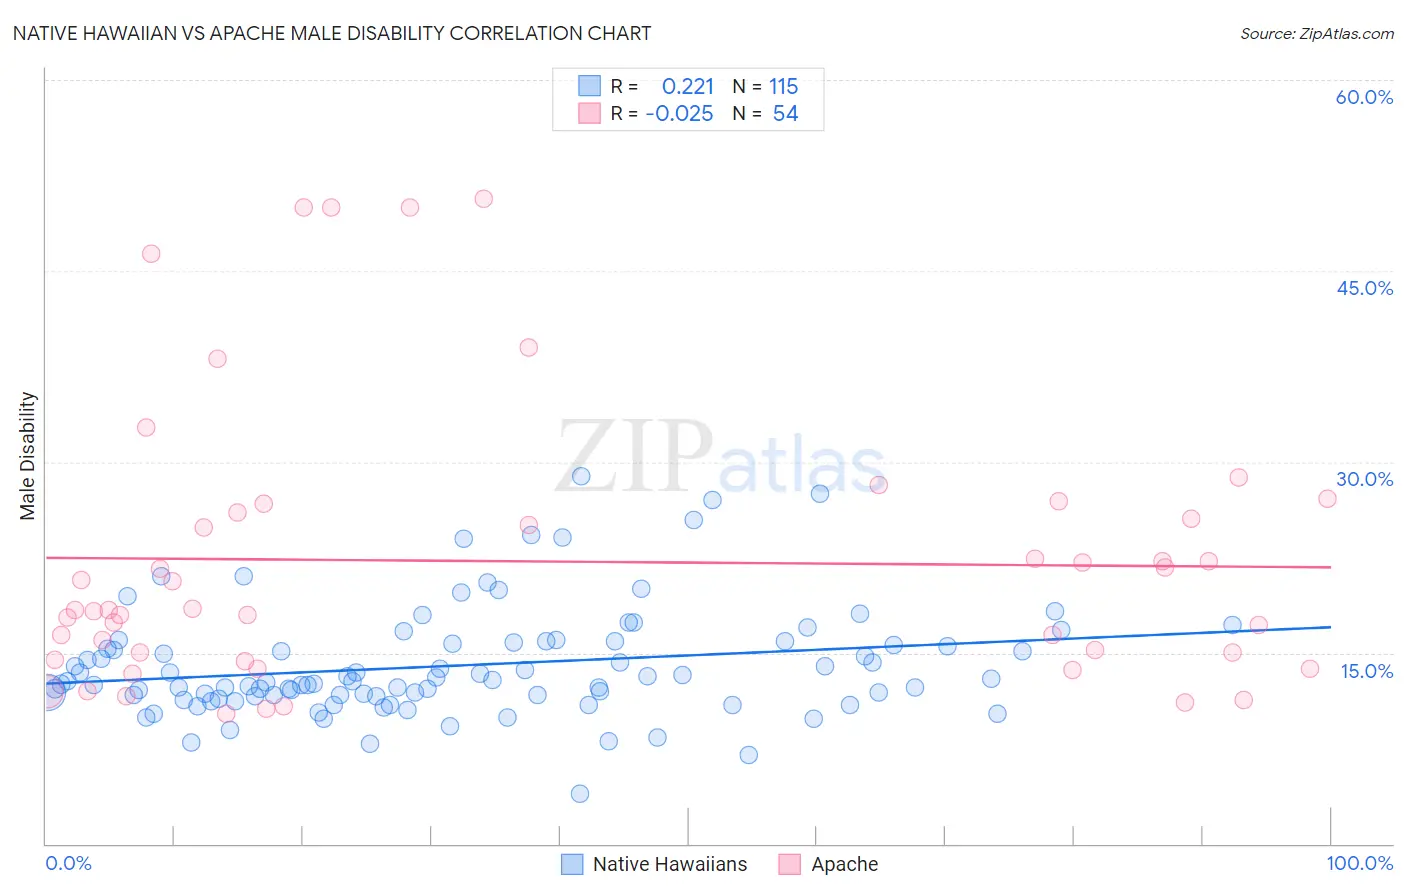
Native Hawaiian vs Apache Male Disability Correlation Chart
The statistical analysis conducted on geographies consisting of 332,022,677 people shows a weak positive correlation between the proportion of Native Hawaiians and percentage of males with a disability in the United States with a correlation coefficient (R) of 0.221 and weighted average of 12.5%. Similarly, the statistical analysis conducted on geographies consisting of 231,062,399 people shows no correlation between the proportion of Apache and percentage of males with a disability in the United States with a correlation coefficient (R) of -0.025 and weighted average of 14.0%, a difference of 12.2%.
Male Disability Correlation Summary
| Measurement | Native Hawaiian | Apache |
| Minimum | 4.0% | 10.2% |
| Maximum | 28.9% | 50.7% |
| Range | 25.0% | 40.5% |
| Mean | 14.0% | 22.2% |
| Median | 12.8% | 18.3% |
| Interquartile 25% (IQ1) | 11.6% | 14.5% |
| Interquartile 75% (IQ3) | 15.8% | 26.0% |
| Interquartile Range (IQR) | 4.2% | 11.6% |
| Standard Deviation (Sample) | 4.3% | 11.0% |
| Standard Deviation (Population) | 4.3% | 10.9% |
Similar Demographics by Male Disability
Demographics Similar to Native Hawaiians by Male Disability
In terms of male disability, the demographic groups most similar to Native Hawaiians are Hmong (12.5%, a difference of 0.060%), Hopi (12.5%, a difference of 0.33%), Fijian (12.6%, a difference of 0.68%), African (12.6%, a difference of 0.74%), and Finnish (12.6%, a difference of 1.1%).
| Demographics | Rating | Rank | Male Disability |
| Hawaiians | 0.1 /100 | #266 | Tragic 12.3% |
| Immigrants | Germany | 0.1 /100 | #267 | Tragic 12.3% |
| Portuguese | 0.1 /100 | #268 | Tragic 12.3% |
| Czechoslovakians | 0.1 /100 | #269 | Tragic 12.3% |
| Spaniards | 0.1 /100 | #270 | Tragic 12.3% |
| Scandinavians | 0.1 /100 | #271 | Tragic 12.3% |
| Hmong | 0.0 /100 | #272 | Tragic 12.5% |
| Native Hawaiians | 0.0 /100 | #273 | Tragic 12.5% |
| Hopi | 0.0 /100 | #274 | Tragic 12.5% |
| Fijians | 0.0 /100 | #275 | Tragic 12.6% |
| Africans | 0.0 /100 | #276 | Tragic 12.6% |
| Finns | 0.0 /100 | #277 | Tragic 12.6% |
| Central American Indians | 0.0 /100 | #278 | Tragic 12.7% |
| Slovaks | 0.0 /100 | #279 | Tragic 12.7% |
| Dutch | 0.0 /100 | #280 | Tragic 12.7% |
Demographics Similar to Apache by Male Disability
In terms of male disability, the demographic groups most similar to Apache are Osage (14.0%, a difference of 0.070%), Comanche (14.1%, a difference of 0.40%), Ottawa (14.1%, a difference of 0.51%), Shoshone (13.8%, a difference of 1.1%), and Tlingit-Haida (13.8%, a difference of 1.2%).
| Demographics | Rating | Rank | Male Disability |
| Iroquois | 0.0 /100 | #315 | Tragic 13.6% |
| Alaska Natives | 0.0 /100 | #316 | Tragic 13.6% |
| Paiute | 0.0 /100 | #317 | Tragic 13.7% |
| Cree | 0.0 /100 | #318 | Tragic 13.7% |
| Americans | 0.0 /100 | #319 | Tragic 13.8% |
| Tlingit-Haida | 0.0 /100 | #320 | Tragic 13.8% |
| Shoshone | 0.0 /100 | #321 | Tragic 13.8% |
| Apache | 0.0 /100 | #322 | Tragic 14.0% |
| Osage | 0.0 /100 | #323 | Tragic 14.0% |
| Comanche | 0.0 /100 | #324 | Tragic 14.1% |
| Ottawa | 0.0 /100 | #325 | Tragic 14.1% |
| Natives/Alaskans | 0.0 /100 | #326 | Tragic 14.2% |
| Potawatomi | 0.0 /100 | #327 | Tragic 14.2% |
| Chippewa | 0.0 /100 | #328 | Tragic 14.3% |
| Cajuns | 0.0 /100 | #329 | Tragic 14.4% |