Brazilian vs Apache Disability Age 65 to 74
COMPARE
Brazilian
Apache
Disability Age 65 to 74
Disability Age 65 to 74 Comparison
Brazilians
Apache
22.4%
DISABILITY AGE 65 TO 74
94.8/ 100
METRIC RATING
116th/ 347
METRIC RANK
29.7%
DISABILITY AGE 65 TO 74
0.0/ 100
METRIC RATING
327th/ 347
METRIC RANK
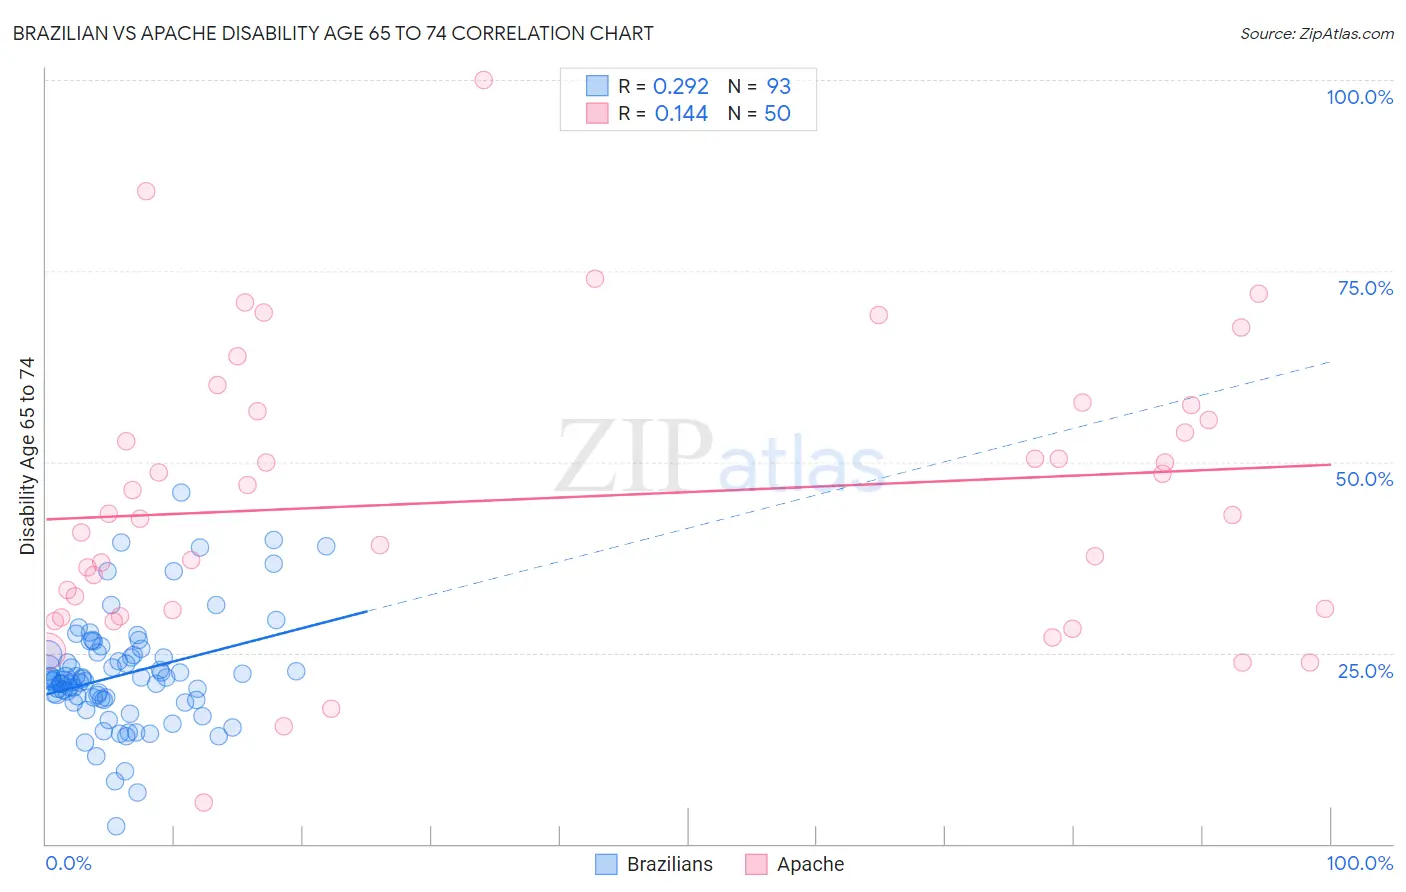
Brazilian vs Apache Disability Age 65 to 74 Correlation Chart
The statistical analysis conducted on geographies consisting of 323,321,623 people shows a weak positive correlation between the proportion of Brazilians and percentage of population with a disability between the ages 65 and 75 in the United States with a correlation coefficient (R) of 0.292 and weighted average of 22.4%. Similarly, the statistical analysis conducted on geographies consisting of 230,808,066 people shows a poor positive correlation between the proportion of Apache and percentage of population with a disability between the ages 65 and 75 in the United States with a correlation coefficient (R) of 0.144 and weighted average of 29.7%, a difference of 32.7%.
Disability Age 65 to 74 Correlation Summary
| Measurement | Brazilian | Apache |
| Minimum | 2.4% | 5.4% |
| Maximum | 45.9% | 100.0% |
| Range | 43.6% | 94.6% |
| Mean | 22.1% | 45.2% |
| Median | 21.5% | 43.2% |
| Interquartile 25% (IQ1) | 18.9% | 30.6% |
| Interquartile 75% (IQ3) | 24.8% | 56.6% |
| Interquartile Range (IQR) | 5.8% | 26.0% |
| Standard Deviation (Sample) | 7.2% | 18.7% |
| Standard Deviation (Population) | 7.1% | 18.6% |
Similar Demographics by Disability Age 65 to 74
Demographics Similar to Brazilians by Disability Age 65 to 74
In terms of disability age 65 to 74, the demographic groups most similar to Brazilians are Swedish (22.4%, a difference of 0.010%), Austrian (22.4%, a difference of 0.020%), Immigrants from Northern Africa (22.4%, a difference of 0.020%), Laotian (22.3%, a difference of 0.040%), and Ukrainian (22.3%, a difference of 0.10%).
| Demographics | Rating | Rank | Disability Age 65 to 74 |
| Albanians | 95.8 /100 | #109 | Exceptional 22.3% |
| Immigrants | Peru | 95.7 /100 | #110 | Exceptional 22.3% |
| Serbians | 95.7 /100 | #111 | Exceptional 22.3% |
| Immigrants | South America | 95.5 /100 | #112 | Exceptional 22.3% |
| Syrians | 95.3 /100 | #113 | Exceptional 22.3% |
| Ukrainians | 95.1 /100 | #114 | Exceptional 22.3% |
| Laotians | 94.9 /100 | #115 | Exceptional 22.3% |
| Brazilians | 94.8 /100 | #116 | Exceptional 22.4% |
| Swedes | 94.7 /100 | #117 | Exceptional 22.4% |
| Austrians | 94.7 /100 | #118 | Exceptional 22.4% |
| Immigrants | Northern Africa | 94.7 /100 | #119 | Exceptional 22.4% |
| Immigrants | Kazakhstan | 93.9 /100 | #120 | Exceptional 22.4% |
| Czechs | 93.5 /100 | #121 | Exceptional 22.4% |
| Immigrants | Jordan | 93.5 /100 | #122 | Exceptional 22.4% |
| Hungarians | 93.3 /100 | #123 | Exceptional 22.4% |
Demographics Similar to Apache by Disability Age 65 to 74
In terms of disability age 65 to 74, the demographic groups most similar to Apache are Yakama (29.6%, a difference of 0.16%), Dutch West Indian (29.6%, a difference of 0.38%), Seminole (29.4%, a difference of 0.83%), Hopi (30.0%, a difference of 0.94%), and Choctaw (30.2%, a difference of 1.8%).
| Demographics | Rating | Rank | Disability Age 65 to 74 |
| Cherokee | 0.0 /100 | #320 | Tragic 28.2% |
| Comanche | 0.0 /100 | #321 | Tragic 28.3% |
| Aleuts | 0.0 /100 | #322 | Tragic 28.4% |
| Puerto Ricans | 0.0 /100 | #323 | Tragic 29.1% |
| Seminole | 0.0 /100 | #324 | Tragic 29.4% |
| Dutch West Indians | 0.0 /100 | #325 | Tragic 29.6% |
| Yakama | 0.0 /100 | #326 | Tragic 29.6% |
| Apache | 0.0 /100 | #327 | Tragic 29.7% |
| Hopi | 0.0 /100 | #328 | Tragic 30.0% |
| Choctaw | 0.0 /100 | #329 | Tragic 30.2% |
| Creek | 0.0 /100 | #330 | Tragic 30.2% |
| Chickasaw | 0.0 /100 | #331 | Tragic 30.2% |
| Natives/Alaskans | 0.0 /100 | #332 | Tragic 30.4% |
| Colville | 0.0 /100 | #333 | Tragic 30.5% |
| Alaska Natives | 0.0 /100 | #334 | Tragic 30.6% |