Navajo vs Apache Male Disability
COMPARE
Navajo
Apache
Male Disability
Male Disability Comparison
Navajo
Apache
14.4%
MALE DISABILITY
0.0/ 100
METRIC RATING
330th/ 347
METRIC RANK
14.0%
MALE DISABILITY
0.0/ 100
METRIC RATING
322nd/ 347
METRIC RANK
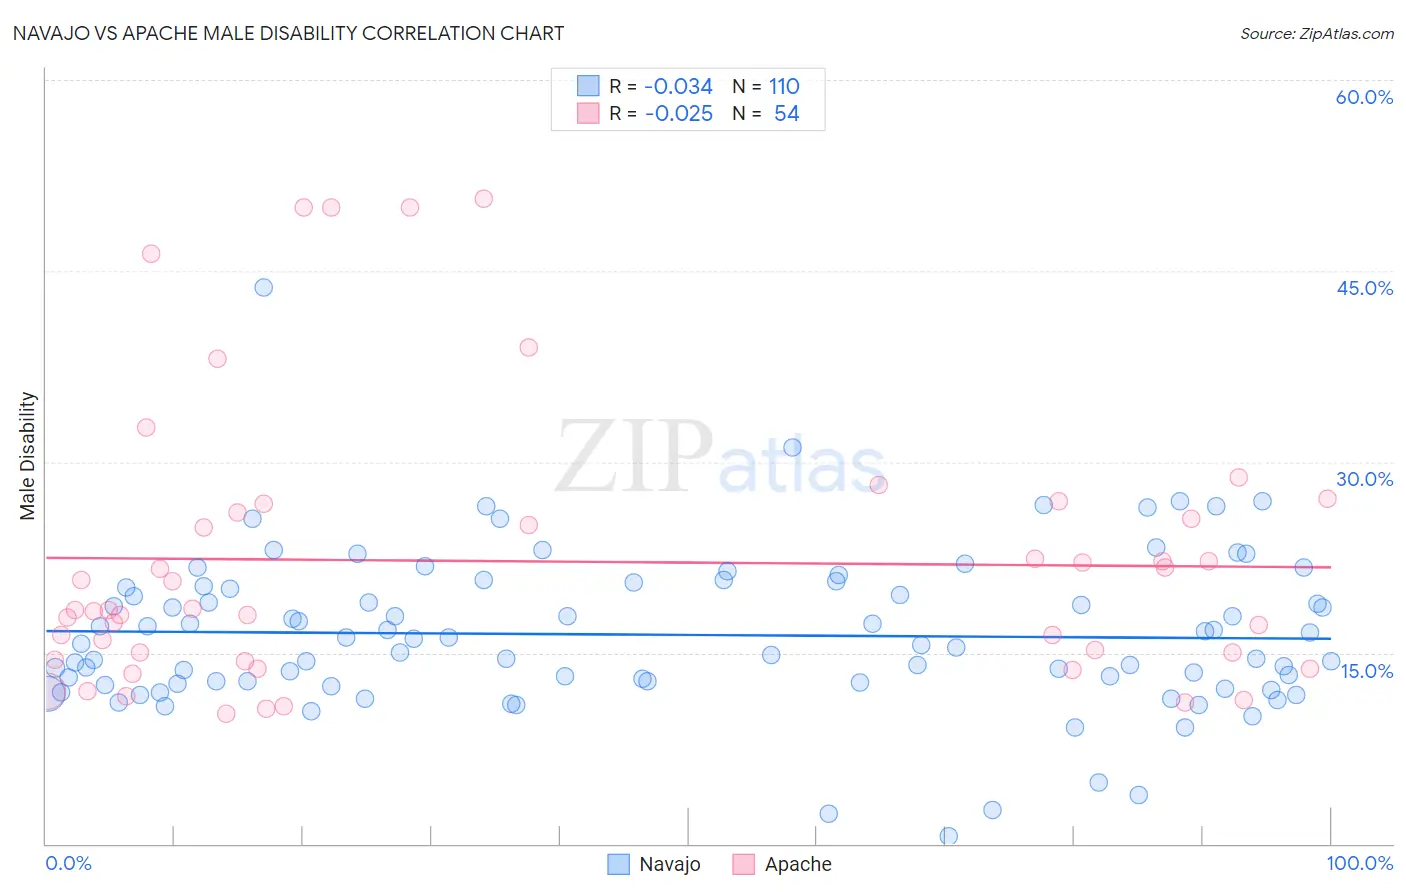
Navajo vs Apache Male Disability Correlation Chart
The statistical analysis conducted on geographies consisting of 224,784,363 people shows no correlation between the proportion of Navajo and percentage of males with a disability in the United States with a correlation coefficient (R) of -0.034 and weighted average of 14.4%. Similarly, the statistical analysis conducted on geographies consisting of 231,062,399 people shows no correlation between the proportion of Apache and percentage of males with a disability in the United States with a correlation coefficient (R) of -0.025 and weighted average of 14.0%, a difference of 2.8%.
Male Disability Correlation Summary
| Measurement | Navajo | Apache |
| Minimum | 0.60% | 10.2% |
| Maximum | 43.7% | 50.7% |
| Range | 43.1% | 40.5% |
| Mean | 16.4% | 22.2% |
| Median | 15.6% | 18.3% |
| Interquartile 25% (IQ1) | 12.7% | 14.5% |
| Interquartile 75% (IQ3) | 20.1% | 26.0% |
| Interquartile Range (IQR) | 7.5% | 11.6% |
| Standard Deviation (Sample) | 6.1% | 11.0% |
| Standard Deviation (Population) | 6.1% | 10.9% |
Demographics Similar to Navajo and Apache by Male Disability
In terms of male disability, the demographic groups most similar to Navajo are Cajun (14.4%, a difference of 0.23%), Chippewa (14.3%, a difference of 0.81%), Potawatomi (14.2%, a difference of 1.2%), Native/Alaskan (14.2%, a difference of 1.3%), and Tohono O'odham (14.6%, a difference of 1.5%). Similarly, the demographic groups most similar to Apache are Osage (14.0%, a difference of 0.070%), Comanche (14.1%, a difference of 0.40%), Ottawa (14.1%, a difference of 0.51%), Shoshone (13.8%, a difference of 1.1%), and Tlingit-Haida (13.8%, a difference of 1.2%).
| Demographics | Rating | Rank | Male Disability |
| Alaska Natives | 0.0 /100 | #316 | Tragic 13.6% |
| Paiute | 0.0 /100 | #317 | Tragic 13.7% |
| Cree | 0.0 /100 | #318 | Tragic 13.7% |
| Americans | 0.0 /100 | #319 | Tragic 13.8% |
| Tlingit-Haida | 0.0 /100 | #320 | Tragic 13.8% |
| Shoshone | 0.0 /100 | #321 | Tragic 13.8% |
| Apache | 0.0 /100 | #322 | Tragic 14.0% |
| Osage | 0.0 /100 | #323 | Tragic 14.0% |
| Comanche | 0.0 /100 | #324 | Tragic 14.1% |
| Ottawa | 0.0 /100 | #325 | Tragic 14.1% |
| Natives/Alaskans | 0.0 /100 | #326 | Tragic 14.2% |
| Potawatomi | 0.0 /100 | #327 | Tragic 14.2% |
| Chippewa | 0.0 /100 | #328 | Tragic 14.3% |
| Cajuns | 0.0 /100 | #329 | Tragic 14.4% |
| Navajo | 0.0 /100 | #330 | Tragic 14.4% |
| Tohono O'odham | 0.0 /100 | #331 | Tragic 14.6% |
| Seminole | 0.0 /100 | #332 | Tragic 14.7% |
| Yuman | 0.0 /100 | #333 | Tragic 14.7% |
| Cherokee | 0.0 /100 | #334 | Tragic 14.8% |
| Dutch West Indians | 0.0 /100 | #335 | Tragic 14.8% |
| Alaskan Athabascans | 0.0 /100 | #336 | Tragic 14.9% |