Sudanese vs Apache Male Disability
COMPARE
Sudanese
Apache
Male Disability
Male Disability Comparison
Sudanese
Apache
11.0%
MALE DISABILITY
77.1/ 100
METRIC RATING
148th/ 347
METRIC RANK
14.0%
MALE DISABILITY
0.0/ 100
METRIC RATING
322nd/ 347
METRIC RANK
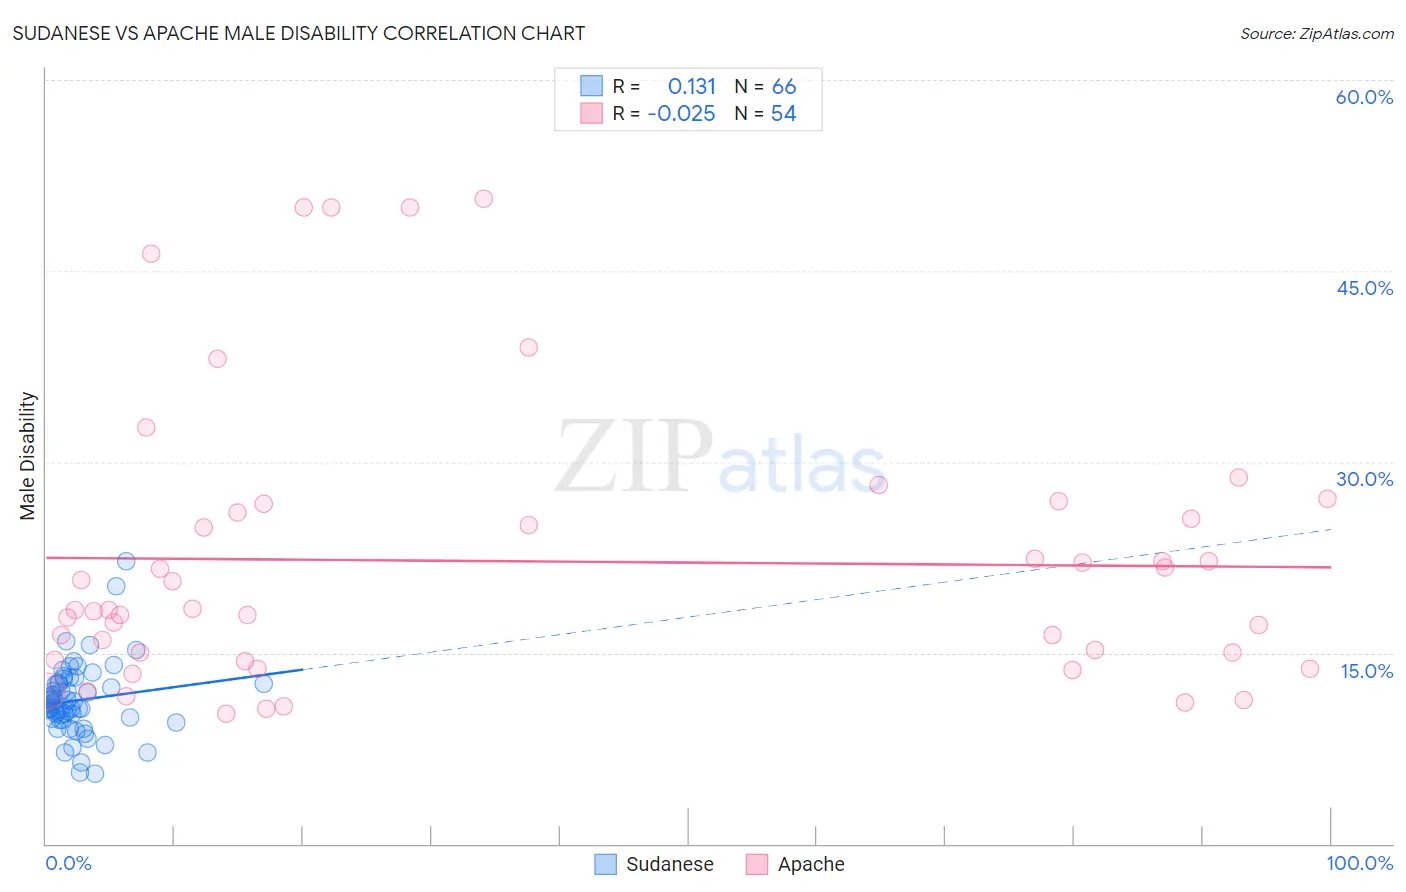
Sudanese vs Apache Male Disability Correlation Chart
The statistical analysis conducted on geographies consisting of 110,141,954 people shows a poor positive correlation between the proportion of Sudanese and percentage of males with a disability in the United States with a correlation coefficient (R) of 0.131 and weighted average of 11.0%. Similarly, the statistical analysis conducted on geographies consisting of 231,062,399 people shows no correlation between the proportion of Apache and percentage of males with a disability in the United States with a correlation coefficient (R) of -0.025 and weighted average of 14.0%, a difference of 27.0%.
Male Disability Correlation Summary
| Measurement | Sudanese | Apache |
| Minimum | 5.5% | 10.2% |
| Maximum | 22.1% | 50.7% |
| Range | 16.7% | 40.5% |
| Mean | 11.3% | 22.2% |
| Median | 11.1% | 18.3% |
| Interquartile 25% (IQ1) | 9.8% | 14.5% |
| Interquartile 75% (IQ3) | 12.6% | 26.0% |
| Interquartile Range (IQR) | 2.7% | 11.6% |
| Standard Deviation (Sample) | 2.8% | 11.0% |
| Standard Deviation (Population) | 2.8% | 10.9% |
Similar Demographics by Male Disability
Demographics Similar to Sudanese by Male Disability
In terms of male disability, the demographic groups most similar to Sudanese are Immigrants from Croatia (11.0%, a difference of 0.010%), Korean (11.0%, a difference of 0.030%), Immigrants from Denmark (11.0%, a difference of 0.060%), Costa Rican (11.0%, a difference of 0.070%), and Kenyan (11.0%, a difference of 0.080%).
| Demographics | Rating | Rank | Male Disability |
| Arabs | 81.5 /100 | #141 | Excellent 11.0% |
| Immigrants | Sudan | 81.5 /100 | #142 | Excellent 11.0% |
| Moroccans | 80.7 /100 | #143 | Excellent 11.0% |
| Kenyans | 78.1 /100 | #144 | Good 11.0% |
| Costa Ricans | 78.0 /100 | #145 | Good 11.0% |
| Koreans | 77.5 /100 | #146 | Good 11.0% |
| Immigrants | Croatia | 77.3 /100 | #147 | Good 11.0% |
| Sudanese | 77.1 /100 | #148 | Good 11.0% |
| Immigrants | Denmark | 76.4 /100 | #149 | Good 11.0% |
| Immigrants | Guatemala | 75.1 /100 | #150 | Good 11.0% |
| Cubans | 74.9 /100 | #151 | Good 11.0% |
| Immigrants | Albania | 74.4 /100 | #152 | Good 11.0% |
| Immigrants | Northern Europe | 73.2 /100 | #153 | Good 11.1% |
| Immigrants | Moldova | 72.8 /100 | #154 | Good 11.1% |
| Immigrants | Middle Africa | 70.9 /100 | #155 | Good 11.1% |
Demographics Similar to Apache by Male Disability
In terms of male disability, the demographic groups most similar to Apache are Osage (14.0%, a difference of 0.070%), Comanche (14.1%, a difference of 0.40%), Ottawa (14.1%, a difference of 0.51%), Shoshone (13.8%, a difference of 1.1%), and Tlingit-Haida (13.8%, a difference of 1.2%).
| Demographics | Rating | Rank | Male Disability |
| Iroquois | 0.0 /100 | #315 | Tragic 13.6% |
| Alaska Natives | 0.0 /100 | #316 | Tragic 13.6% |
| Paiute | 0.0 /100 | #317 | Tragic 13.7% |
| Cree | 0.0 /100 | #318 | Tragic 13.7% |
| Americans | 0.0 /100 | #319 | Tragic 13.8% |
| Tlingit-Haida | 0.0 /100 | #320 | Tragic 13.8% |
| Shoshone | 0.0 /100 | #321 | Tragic 13.8% |
| Apache | 0.0 /100 | #322 | Tragic 14.0% |
| Osage | 0.0 /100 | #323 | Tragic 14.0% |
| Comanche | 0.0 /100 | #324 | Tragic 14.1% |
| Ottawa | 0.0 /100 | #325 | Tragic 14.1% |
| Natives/Alaskans | 0.0 /100 | #326 | Tragic 14.2% |
| Potawatomi | 0.0 /100 | #327 | Tragic 14.2% |
| Chippewa | 0.0 /100 | #328 | Tragic 14.3% |
| Cajuns | 0.0 /100 | #329 | Tragic 14.4% |