Blackfeet vs Apache Male Disability
COMPARE
Blackfeet
Apache
Male Disability
Male Disability Comparison
Blackfeet
Apache
13.4%
MALE DISABILITY
0.0/ 100
METRIC RATING
309th/ 347
METRIC RANK
14.0%
MALE DISABILITY
0.0/ 100
METRIC RATING
322nd/ 347
METRIC RANK
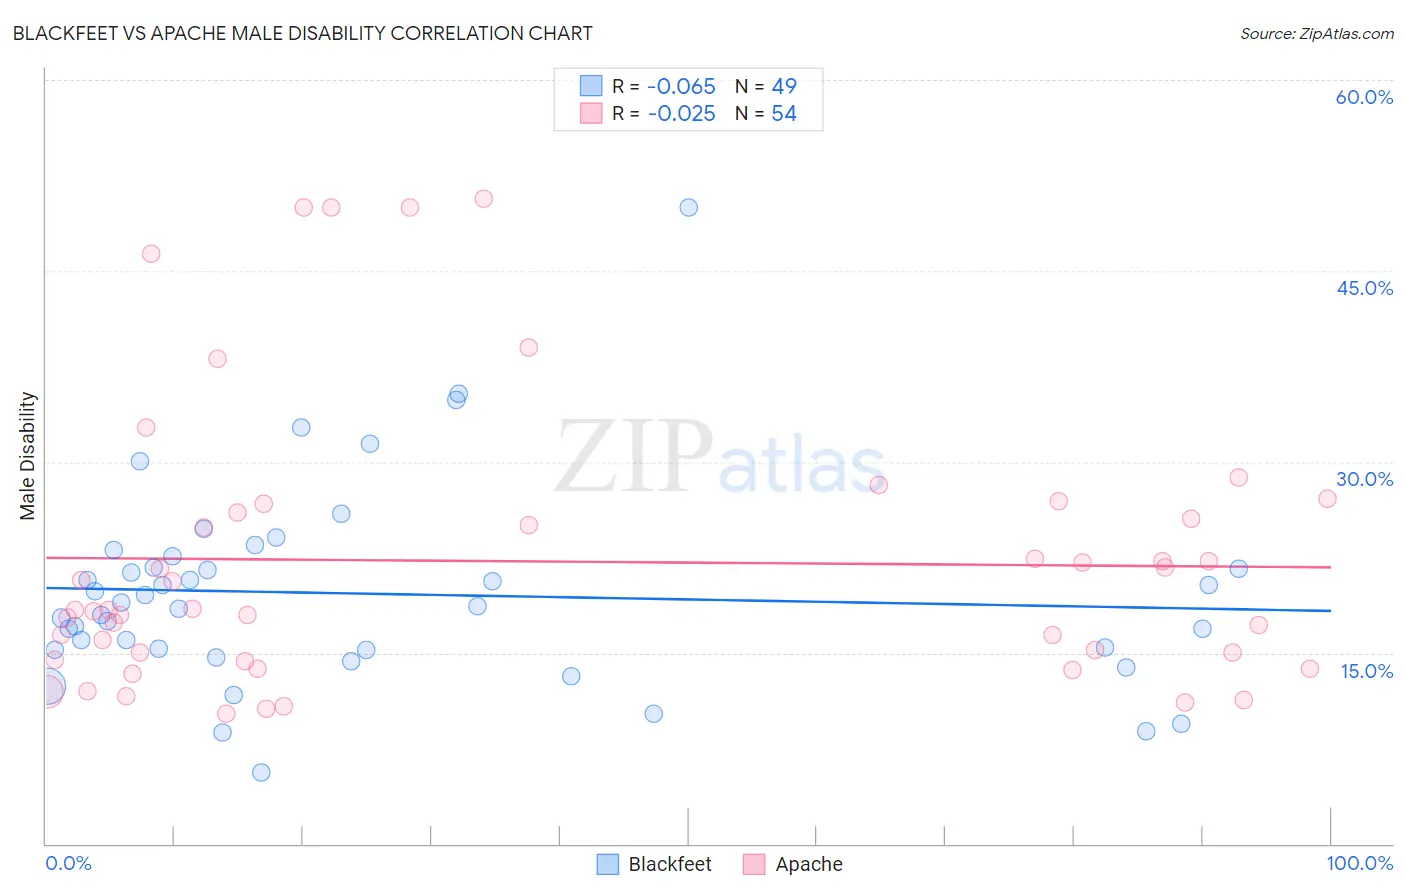
Blackfeet vs Apache Male Disability Correlation Chart
The statistical analysis conducted on geographies consisting of 309,505,092 people shows a slight negative correlation between the proportion of Blackfeet and percentage of males with a disability in the United States with a correlation coefficient (R) of -0.065 and weighted average of 13.4%. Similarly, the statistical analysis conducted on geographies consisting of 231,062,399 people shows no correlation between the proportion of Apache and percentage of males with a disability in the United States with a correlation coefficient (R) of -0.025 and weighted average of 14.0%, a difference of 4.3%.
Male Disability Correlation Summary
| Measurement | Blackfeet | Apache |
| Minimum | 5.6% | 10.2% |
| Maximum | 50.0% | 50.7% |
| Range | 44.4% | 40.5% |
| Mean | 19.6% | 22.2% |
| Median | 18.6% | 18.3% |
| Interquartile 25% (IQ1) | 15.2% | 14.5% |
| Interquartile 75% (IQ3) | 22.2% | 26.0% |
| Interquartile Range (IQR) | 6.9% | 11.6% |
| Standard Deviation (Sample) | 7.9% | 11.0% |
| Standard Deviation (Population) | 7.8% | 10.9% |
Demographics Similar to Blackfeet and Apache by Male Disability
In terms of male disability, the demographic groups most similar to Blackfeet are Immigrants from the Azores (13.4%, a difference of 0.14%), Delaware (13.5%, a difference of 0.33%), French American Indian (13.4%, a difference of 0.42%), Arapaho (13.3%, a difference of 0.58%), and Spanish American (13.3%, a difference of 0.80%). Similarly, the demographic groups most similar to Apache are Osage (14.0%, a difference of 0.070%), Comanche (14.1%, a difference of 0.40%), Ottawa (14.1%, a difference of 0.51%), Shoshone (13.8%, a difference of 1.1%), and Tlingit-Haida (13.8%, a difference of 1.2%).
| Demographics | Rating | Rank | Male Disability |
| French Canadians | 0.0 /100 | #305 | Tragic 13.3% |
| Spanish Americans | 0.0 /100 | #306 | Tragic 13.3% |
| Arapaho | 0.0 /100 | #307 | Tragic 13.3% |
| French American Indians | 0.0 /100 | #308 | Tragic 13.4% |
| Blackfeet | 0.0 /100 | #309 | Tragic 13.4% |
| Immigrants | Azores | 0.0 /100 | #310 | Tragic 13.4% |
| Delaware | 0.0 /100 | #311 | Tragic 13.5% |
| Yakama | 0.0 /100 | #312 | Tragic 13.5% |
| Puget Sound Salish | 0.0 /100 | #313 | Tragic 13.5% |
| Aleuts | 0.0 /100 | #314 | Tragic 13.5% |
| Iroquois | 0.0 /100 | #315 | Tragic 13.6% |
| Alaska Natives | 0.0 /100 | #316 | Tragic 13.6% |
| Paiute | 0.0 /100 | #317 | Tragic 13.7% |
| Cree | 0.0 /100 | #318 | Tragic 13.7% |
| Americans | 0.0 /100 | #319 | Tragic 13.8% |
| Tlingit-Haida | 0.0 /100 | #320 | Tragic 13.8% |
| Shoshone | 0.0 /100 | #321 | Tragic 13.8% |
| Apache | 0.0 /100 | #322 | Tragic 14.0% |
| Osage | 0.0 /100 | #323 | Tragic 14.0% |
| Comanche | 0.0 /100 | #324 | Tragic 14.1% |
| Ottawa | 0.0 /100 | #325 | Tragic 14.1% |