Bangladeshi vs Immigrants from Kenya Disability
COMPARE
Bangladeshi
Immigrants from Kenya
Disability
Disability Comparison
Bangladeshis
Immigrants from Kenya
12.6%
DISABILITY
0.1/ 100
METRIC RATING
268th/ 347
METRIC RANK
11.6%
DISABILITY
72.1/ 100
METRIC RATING
151st/ 347
METRIC RANK
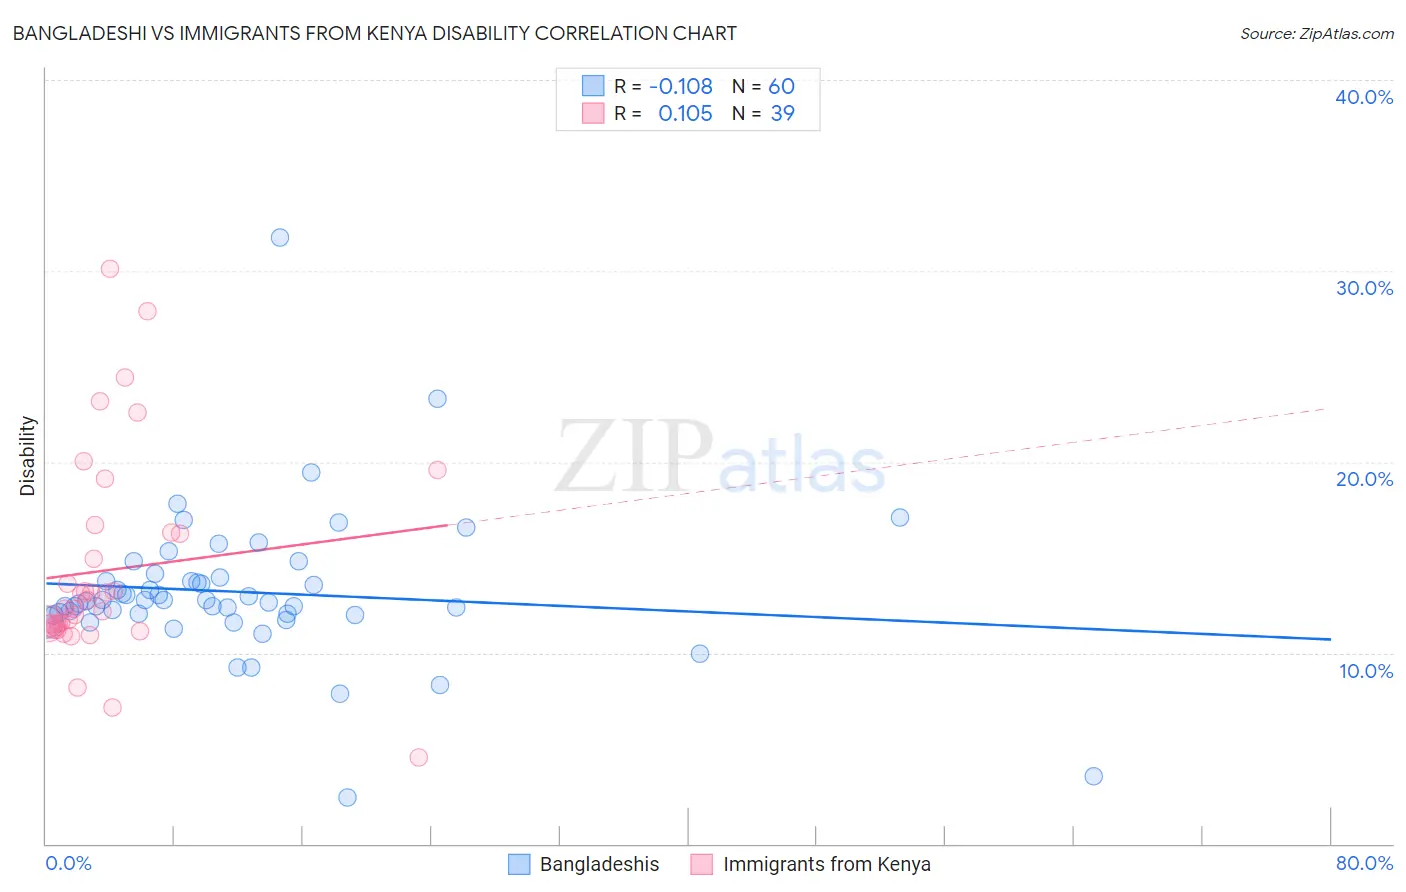
Bangladeshi vs Immigrants from Kenya Disability Correlation Chart
The statistical analysis conducted on geographies consisting of 141,399,990 people shows a poor negative correlation between the proportion of Bangladeshis and percentage of population with a disability in the United States with a correlation coefficient (R) of -0.108 and weighted average of 12.6%. Similarly, the statistical analysis conducted on geographies consisting of 218,058,395 people shows a poor positive correlation between the proportion of Immigrants from Kenya and percentage of population with a disability in the United States with a correlation coefficient (R) of 0.105 and weighted average of 11.6%, a difference of 8.5%.
Disability Correlation Summary
| Measurement | Bangladeshi | Immigrants from Kenya |
| Minimum | 2.4% | 4.5% |
| Maximum | 31.8% | 30.1% |
| Range | 29.3% | 25.6% |
| Mean | 13.2% | 14.3% |
| Median | 12.7% | 12.3% |
| Interquartile 25% (IQ1) | 12.0% | 11.4% |
| Interquartile 75% (IQ3) | 13.8% | 16.3% |
| Interquartile Range (IQR) | 1.8% | 4.9% |
| Standard Deviation (Sample) | 4.0% | 5.4% |
| Standard Deviation (Population) | 3.9% | 5.3% |
Similar Demographics by Disability
Demographics Similar to Bangladeshis by Disability
In terms of disability, the demographic groups most similar to Bangladeshis are Immigrants from Dominican Republic (12.6%, a difference of 0.090%), Spaniard (12.5%, a difference of 0.33%), Czechoslovakian (12.5%, a difference of 0.40%), Portuguese (12.6%, a difference of 0.48%), and Immigrants from Yemen (12.6%, a difference of 0.53%).
| Demographics | Rating | Rank | Disability |
| Scandinavians | 0.4 /100 | #261 | Tragic 12.4% |
| Native Hawaiians | 0.3 /100 | #262 | Tragic 12.5% |
| Hawaiians | 0.2 /100 | #263 | Tragic 12.5% |
| Immigrants | Germany | 0.2 /100 | #264 | Tragic 12.5% |
| U.S. Virgin Islanders | 0.2 /100 | #265 | Tragic 12.5% |
| Czechoslovakians | 0.2 /100 | #266 | Tragic 12.5% |
| Spaniards | 0.2 /100 | #267 | Tragic 12.5% |
| Bangladeshis | 0.1 /100 | #268 | Tragic 12.6% |
| Immigrants | Dominican Republic | 0.1 /100 | #269 | Tragic 12.6% |
| Portuguese | 0.1 /100 | #270 | Tragic 12.6% |
| Immigrants | Yemen | 0.1 /100 | #271 | Tragic 12.6% |
| Dominicans | 0.0 /100 | #272 | Tragic 12.7% |
| Finns | 0.0 /100 | #273 | Tragic 12.7% |
| Nepalese | 0.0 /100 | #274 | Tragic 12.8% |
| Sioux | 0.0 /100 | #275 | Tragic 12.8% |
Demographics Similar to Immigrants from Kenya by Disability
In terms of disability, the demographic groups most similar to Immigrants from Kenya are Immigrants from Moldova (11.6%, a difference of 0.0%), Romanian (11.6%, a difference of 0.030%), Immigrants from Ghana (11.6%, a difference of 0.050%), Immigrants from Guatemala (11.6%, a difference of 0.050%), and Immigrants from Norway (11.6%, a difference of 0.060%).
| Demographics | Rating | Rank | Disability |
| Australians | 82.5 /100 | #144 | Excellent 11.5% |
| Nigerians | 81.3 /100 | #145 | Excellent 11.5% |
| Immigrants | Hungary | 79.0 /100 | #146 | Good 11.5% |
| Immigrants | Ukraine | 77.6 /100 | #147 | Good 11.5% |
| Sudanese | 77.1 /100 | #148 | Good 11.5% |
| Immigrants | Norway | 73.2 /100 | #149 | Good 11.6% |
| Romanians | 72.7 /100 | #150 | Good 11.6% |
| Immigrants | Kenya | 72.1 /100 | #151 | Good 11.6% |
| Immigrants | Moldova | 72.0 /100 | #152 | Good 11.6% |
| Immigrants | Ghana | 71.2 /100 | #153 | Good 11.6% |
| Immigrants | Guatemala | 71.1 /100 | #154 | Good 11.6% |
| Immigrants | Netherlands | 69.8 /100 | #155 | Good 11.6% |
| Immigrants | Fiji | 69.5 /100 | #156 | Good 11.6% |
| Immigrants | Middle Africa | 69.5 /100 | #157 | Good 11.6% |
| Armenians | 65.9 /100 | #158 | Good 11.6% |