Trinidadian and Tobagonian vs Immigrants from Kenya Disability
COMPARE
Trinidadian and Tobagonian
Immigrants from Kenya
Disability
Disability Comparison
Trinidadians and Tobagonians
Immigrants from Kenya
11.7%
DISABILITY
52.7/ 100
METRIC RATING
172nd/ 347
METRIC RANK
11.6%
DISABILITY
72.1/ 100
METRIC RATING
151st/ 347
METRIC RANK
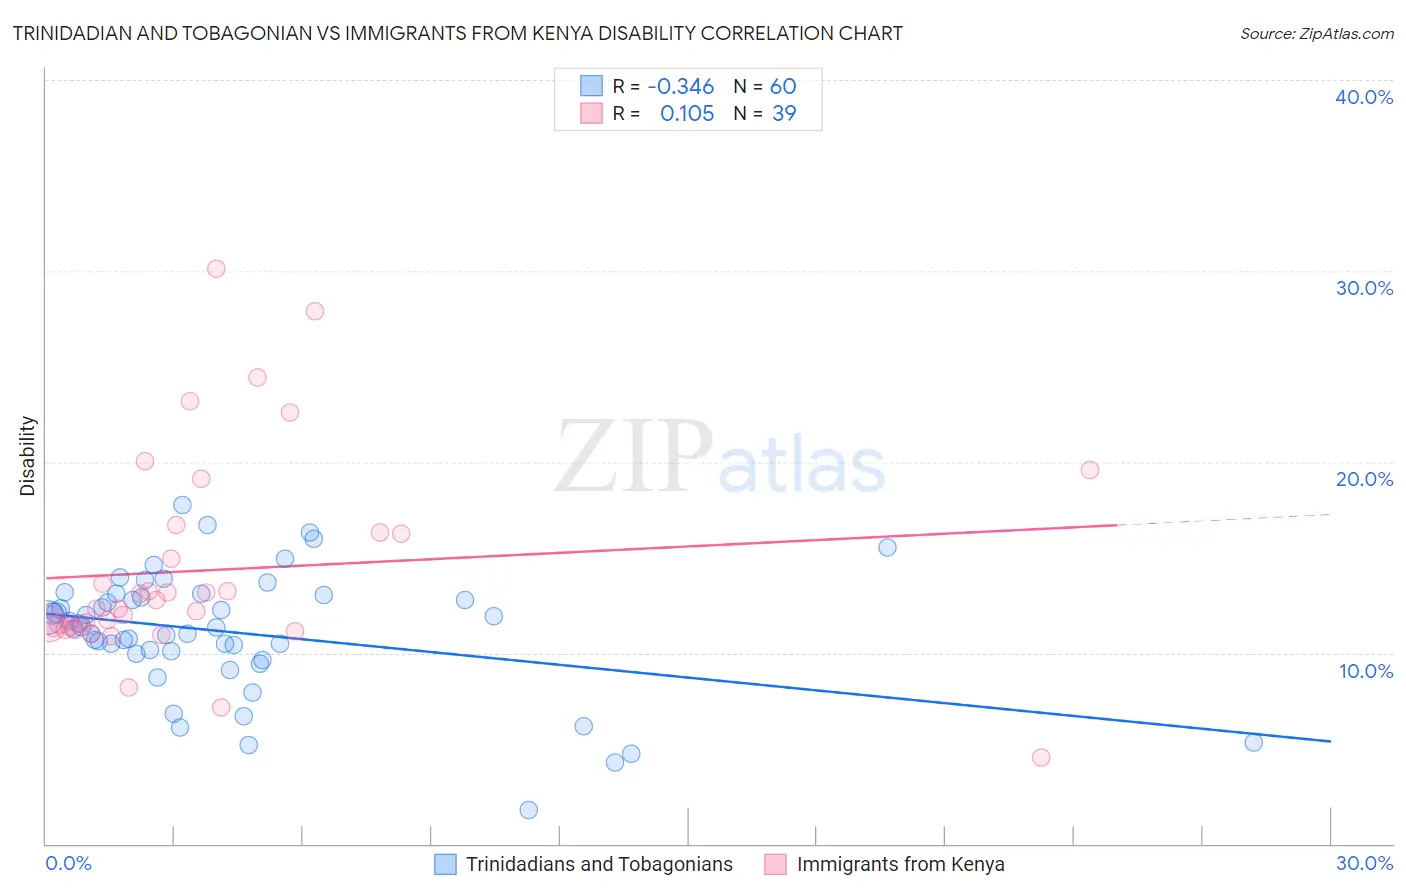
Trinidadian and Tobagonian vs Immigrants from Kenya Disability Correlation Chart
The statistical analysis conducted on geographies consisting of 219,849,540 people shows a mild negative correlation between the proportion of Trinidadians and Tobagonians and percentage of population with a disability in the United States with a correlation coefficient (R) of -0.346 and weighted average of 11.7%. Similarly, the statistical analysis conducted on geographies consisting of 218,058,395 people shows a poor positive correlation between the proportion of Immigrants from Kenya and percentage of population with a disability in the United States with a correlation coefficient (R) of 0.105 and weighted average of 11.6%, a difference of 0.94%.
Disability Correlation Summary
| Measurement | Trinidadian and Tobagonian | Immigrants from Kenya |
| Minimum | 1.7% | 4.5% |
| Maximum | 17.7% | 30.1% |
| Range | 16.0% | 25.6% |
| Mean | 11.1% | 14.3% |
| Median | 11.4% | 12.3% |
| Interquartile 25% (IQ1) | 10.0% | 11.4% |
| Interquartile 75% (IQ3) | 13.0% | 16.3% |
| Interquartile Range (IQR) | 2.9% | 4.9% |
| Standard Deviation (Sample) | 3.2% | 5.4% |
| Standard Deviation (Population) | 3.2% | 5.3% |
Similar Demographics by Disability
Demographics Similar to Trinidadians and Tobagonians by Disability
In terms of disability, the demographic groups most similar to Trinidadians and Tobagonians are Immigrants from Albania (11.7%, a difference of 0.010%), Immigrants from Southern Europe (11.7%, a difference of 0.010%), Immigrants from Austria (11.7%, a difference of 0.030%), Immigrants from Latin America (11.7%, a difference of 0.060%), and Estonian (11.7%, a difference of 0.080%).
| Demographics | Rating | Rank | Disability |
| Cubans | 56.7 /100 | #165 | Average 11.7% |
| Pakistanis | 54.7 /100 | #166 | Average 11.7% |
| Estonians | 54.4 /100 | #167 | Average 11.7% |
| Immigrants | Latin America | 54.1 /100 | #168 | Average 11.7% |
| Immigrants | Austria | 53.4 /100 | #169 | Average 11.7% |
| Immigrants | Albania | 52.8 /100 | #170 | Average 11.7% |
| Immigrants | Southern Europe | 52.8 /100 | #171 | Average 11.7% |
| Trinidadians and Tobagonians | 52.7 /100 | #172 | Average 11.7% |
| Maltese | 50.6 /100 | #173 | Average 11.7% |
| Albanians | 50.0 /100 | #174 | Average 11.7% |
| Haitians | 48.6 /100 | #175 | Average 11.7% |
| Immigrants | Western Africa | 47.5 /100 | #176 | Average 11.7% |
| Immigrants | Central America | 46.6 /100 | #177 | Average 11.7% |
| Greeks | 46.2 /100 | #178 | Average 11.7% |
| Immigrants | Armenia | 41.9 /100 | #179 | Average 11.7% |
Demographics Similar to Immigrants from Kenya by Disability
In terms of disability, the demographic groups most similar to Immigrants from Kenya are Immigrants from Moldova (11.6%, a difference of 0.0%), Romanian (11.6%, a difference of 0.030%), Immigrants from Ghana (11.6%, a difference of 0.050%), Immigrants from Guatemala (11.6%, a difference of 0.050%), and Immigrants from Norway (11.6%, a difference of 0.060%).
| Demographics | Rating | Rank | Disability |
| Australians | 82.5 /100 | #144 | Excellent 11.5% |
| Nigerians | 81.3 /100 | #145 | Excellent 11.5% |
| Immigrants | Hungary | 79.0 /100 | #146 | Good 11.5% |
| Immigrants | Ukraine | 77.6 /100 | #147 | Good 11.5% |
| Sudanese | 77.1 /100 | #148 | Good 11.5% |
| Immigrants | Norway | 73.2 /100 | #149 | Good 11.6% |
| Romanians | 72.7 /100 | #150 | Good 11.6% |
| Immigrants | Kenya | 72.1 /100 | #151 | Good 11.6% |
| Immigrants | Moldova | 72.0 /100 | #152 | Good 11.6% |
| Immigrants | Ghana | 71.2 /100 | #153 | Good 11.6% |
| Immigrants | Guatemala | 71.1 /100 | #154 | Good 11.6% |
| Immigrants | Netherlands | 69.8 /100 | #155 | Good 11.6% |
| Immigrants | Fiji | 69.5 /100 | #156 | Good 11.6% |
| Immigrants | Middle Africa | 69.5 /100 | #157 | Good 11.6% |
| Armenians | 65.9 /100 | #158 | Good 11.6% |