Bahamian vs Comanche Disability Age 35 to 64
COMPARE
Bahamian
Comanche
Disability Age 35 to 64
Disability Age 35 to 64 Comparison
Bahamians
Comanche
11.8%
DISABILITY AGE 35 TO 64
10.7/ 100
METRIC RATING
216th/ 347
METRIC RANK
14.7%
DISABILITY AGE 35 TO 64
0.0/ 100
METRIC RATING
321st/ 347
METRIC RANK
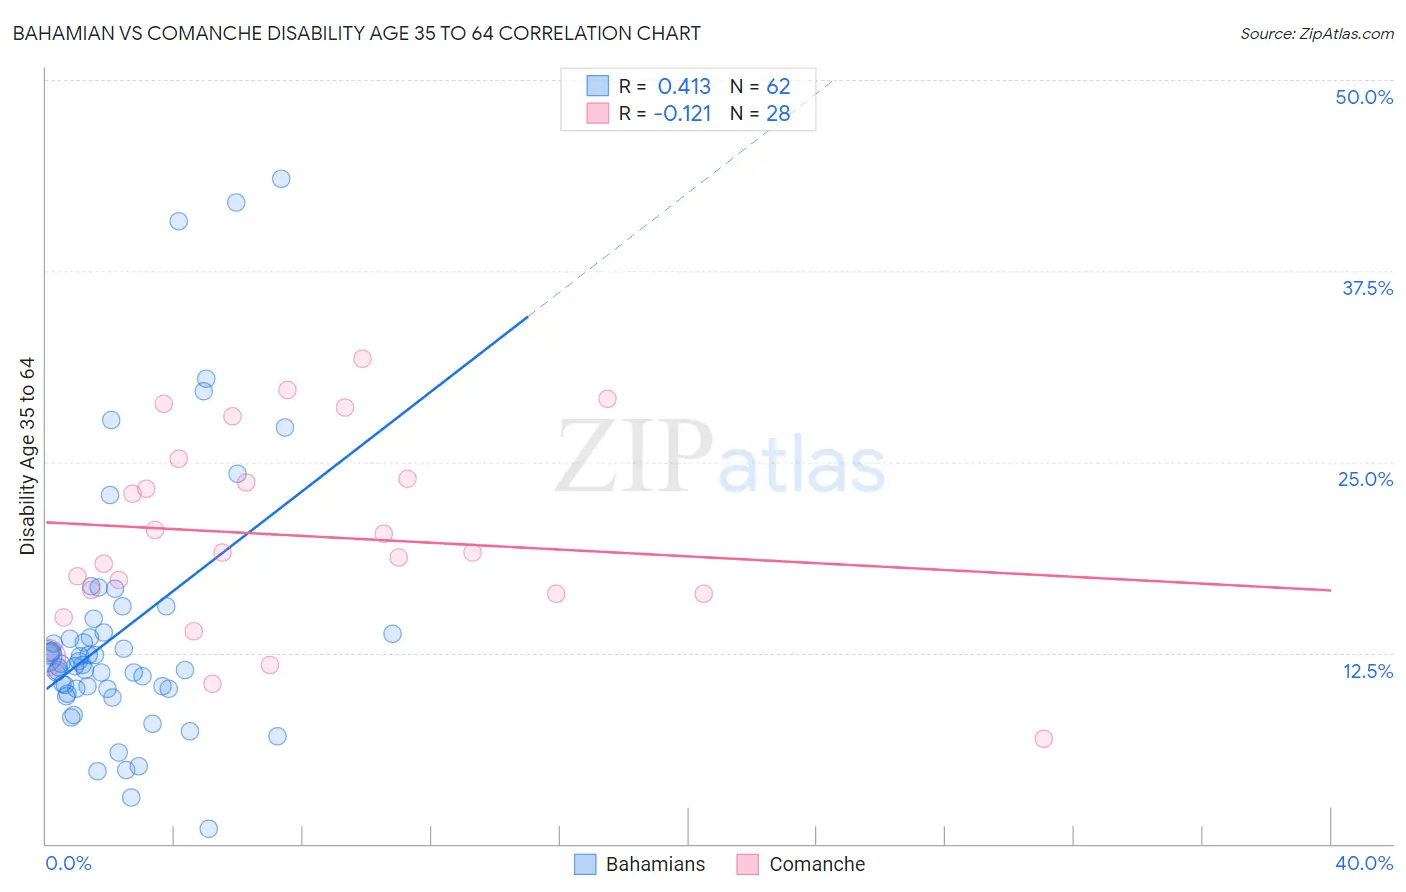
Bahamian vs Comanche Disability Age 35 to 64 Correlation Chart
The statistical analysis conducted on geographies consisting of 112,619,678 people shows a moderate positive correlation between the proportion of Bahamians and percentage of population with a disability between the ages 34 and 64 in the United States with a correlation coefficient (R) of 0.413 and weighted average of 11.8%. Similarly, the statistical analysis conducted on geographies consisting of 109,769,309 people shows a poor negative correlation between the proportion of Comanche and percentage of population with a disability between the ages 34 and 64 in the United States with a correlation coefficient (R) of -0.121 and weighted average of 14.7%, a difference of 25.5%.
Disability Age 35 to 64 Correlation Summary
| Measurement | Bahamian | Comanche |
| Minimum | 0.98% | 6.9% |
| Maximum | 43.5% | 31.7% |
| Range | 42.6% | 24.8% |
| Mean | 14.0% | 20.2% |
| Median | 11.8% | 19.1% |
| Interquartile 25% (IQ1) | 10.1% | 16.4% |
| Interquartile 75% (IQ3) | 13.8% | 24.6% |
| Interquartile Range (IQR) | 3.7% | 8.2% |
| Standard Deviation (Sample) | 8.6% | 6.4% |
| Standard Deviation (Population) | 8.5% | 6.3% |
Similar Demographics by Disability Age 35 to 64
Demographics Similar to Bahamians by Disability Age 35 to 64
In terms of disability age 35 to 64, the demographic groups most similar to Bahamians are Spanish American Indian (11.7%, a difference of 0.090%), Immigrants from Sudan (11.7%, a difference of 0.14%), Yugoslavian (11.7%, a difference of 0.18%), Immigrants from Jamaica (11.7%, a difference of 0.21%), and Barbadian (11.8%, a difference of 0.26%).
| Demographics | Rating | Rank | Disability Age 35 to 64 |
| Europeans | 13.5 /100 | #209 | Poor 11.7% |
| Belgians | 13.1 /100 | #210 | Poor 11.7% |
| Canadians | 13.0 /100 | #211 | Poor 11.7% |
| Immigrants | Jamaica | 11.8 /100 | #212 | Poor 11.7% |
| Yugoslavians | 11.6 /100 | #213 | Poor 11.7% |
| Immigrants | Sudan | 11.4 /100 | #214 | Poor 11.7% |
| Spanish American Indians | 11.1 /100 | #215 | Poor 11.7% |
| Bahamians | 10.7 /100 | #216 | Poor 11.8% |
| Barbadians | 9.5 /100 | #217 | Tragic 11.8% |
| Immigrants | Bahamas | 9.2 /100 | #218 | Tragic 11.8% |
| Czechoslovakians | 9.0 /100 | #219 | Tragic 11.8% |
| Immigrants | West Indies | 8.9 /100 | #220 | Tragic 11.8% |
| Alsatians | 8.5 /100 | #221 | Tragic 11.8% |
| Hondurans | 8.4 /100 | #222 | Tragic 11.8% |
| Immigrants | Honduras | 8.4 /100 | #223 | Tragic 11.8% |
Demographics Similar to Comanche by Disability Age 35 to 64
In terms of disability age 35 to 64, the demographic groups most similar to Comanche are Potawatomi (14.8%, a difference of 0.040%), Black/African American (14.7%, a difference of 0.26%), Immigrants from Cabo Verde (14.7%, a difference of 0.41%), Ottawa (14.6%, a difference of 0.83%), and Crow (14.6%, a difference of 0.90%).
| Demographics | Rating | Rank | Disability Age 35 to 64 |
| Shoshone | 0.0 /100 | #314 | Tragic 14.5% |
| Alaska Natives | 0.0 /100 | #315 | Tragic 14.5% |
| Osage | 0.0 /100 | #316 | Tragic 14.5% |
| Crow | 0.0 /100 | #317 | Tragic 14.6% |
| Ottawa | 0.0 /100 | #318 | Tragic 14.6% |
| Immigrants | Cabo Verde | 0.0 /100 | #319 | Tragic 14.7% |
| Blacks/African Americans | 0.0 /100 | #320 | Tragic 14.7% |
| Comanche | 0.0 /100 | #321 | Tragic 14.7% |
| Potawatomi | 0.0 /100 | #322 | Tragic 14.8% |
| Apache | 0.0 /100 | #323 | Tragic 14.9% |
| Chippewa | 0.0 /100 | #324 | Tragic 15.0% |
| Arapaho | 0.0 /100 | #325 | Tragic 15.1% |
| Natives/Alaskans | 0.0 /100 | #326 | Tragic 15.3% |
| Pueblo | 0.0 /100 | #327 | Tragic 15.3% |
| Cajuns | 0.0 /100 | #328 | Tragic 15.3% |