Bahamian vs Comanche Single Mother Households
COMPARE
Bahamian
Comanche
Single Mother Households
Single Mother Households Comparison
Bahamians
Comanche
8.3%
SINGLE MOTHER HOUSEHOLDS
0.0/ 100
METRIC RATING
320th/ 347
METRIC RANK
7.0%
SINGLE MOTHER HOUSEHOLDS
1.5/ 100
METRIC RATING
232nd/ 347
METRIC RANK
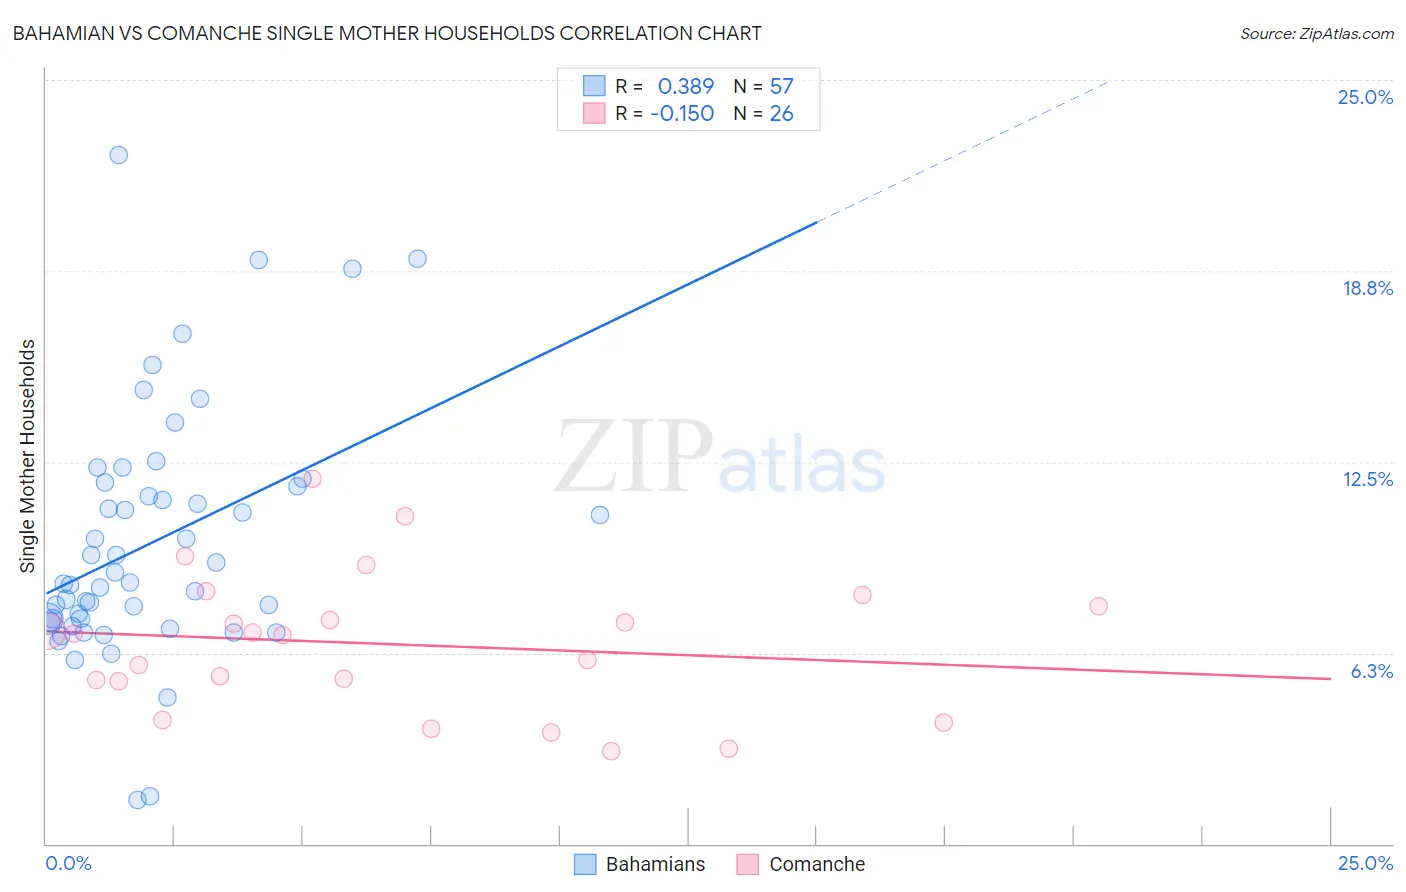
Bahamian vs Comanche Single Mother Households Correlation Chart
The statistical analysis conducted on geographies consisting of 112,454,075 people shows a mild positive correlation between the proportion of Bahamians and percentage of single mother households in the United States with a correlation coefficient (R) of 0.389 and weighted average of 8.3%. Similarly, the statistical analysis conducted on geographies consisting of 109,712,947 people shows a poor negative correlation between the proportion of Comanche and percentage of single mother households in the United States with a correlation coefficient (R) of -0.150 and weighted average of 7.0%, a difference of 17.4%.
Single Mother Households Correlation Summary
| Measurement | Bahamian | Comanche |
| Minimum | 1.4% | 3.0% |
| Maximum | 22.6% | 11.9% |
| Range | 21.1% | 8.9% |
| Mean | 9.9% | 6.5% |
| Median | 8.5% | 6.9% |
| Interquartile 25% (IQ1) | 7.3% | 5.3% |
| Interquartile 75% (IQ3) | 11.8% | 7.8% |
| Interquartile Range (IQR) | 4.5% | 2.5% |
| Standard Deviation (Sample) | 4.1% | 2.3% |
| Standard Deviation (Population) | 4.0% | 2.2% |
Similar Demographics by Single Mother Households
Demographics Similar to Bahamians by Single Mother Households
In terms of single mother households, the demographic groups most similar to Bahamians are Jamaican (8.2%, a difference of 0.12%), Senegalese (8.2%, a difference of 0.23%), Immigrants from Senegal (8.3%, a difference of 0.24%), Pima (8.3%, a difference of 0.32%), and Immigrants from Honduras (8.2%, a difference of 0.80%).
| Demographics | Rating | Rank | Single Mother Households |
| Immigrants | Grenada | 0.0 /100 | #313 | Tragic 8.2% |
| Immigrants | Mexico | 0.0 /100 | #314 | Tragic 8.2% |
| Immigrants | Western Africa | 0.0 /100 | #315 | Tragic 8.2% |
| Africans | 0.0 /100 | #316 | Tragic 8.2% |
| Immigrants | Honduras | 0.0 /100 | #317 | Tragic 8.2% |
| Senegalese | 0.0 /100 | #318 | Tragic 8.2% |
| Jamaicans | 0.0 /100 | #319 | Tragic 8.2% |
| Bahamians | 0.0 /100 | #320 | Tragic 8.3% |
| Immigrants | Senegal | 0.0 /100 | #321 | Tragic 8.3% |
| Pima | 0.0 /100 | #322 | Tragic 8.3% |
| Haitians | 0.0 /100 | #323 | Tragic 8.3% |
| Immigrants | Jamaica | 0.0 /100 | #324 | Tragic 8.4% |
| Immigrants | Caribbean | 0.0 /100 | #325 | Tragic 8.4% |
| British West Indians | 0.0 /100 | #326 | Tragic 8.4% |
| Immigrants | Haiti | 0.0 /100 | #327 | Tragic 8.4% |
Demographics Similar to Comanche by Single Mother Households
In terms of single mother households, the demographic groups most similar to Comanche are Spanish American (7.0%, a difference of 0.060%), Creek (7.0%, a difference of 0.080%), Choctaw (7.0%, a difference of 0.17%), Chickasaw (7.0%, a difference of 0.19%), and Immigrants from Burma/Myanmar (7.0%, a difference of 0.26%).
| Demographics | Rating | Rank | Single Mother Households |
| Sudanese | 3.1 /100 | #225 | Tragic 6.9% |
| Paiute | 2.4 /100 | #226 | Tragic 7.0% |
| Kenyans | 2.3 /100 | #227 | Tragic 7.0% |
| Iroquois | 2.2 /100 | #228 | Tragic 7.0% |
| Immigrants | Kenya | 2.1 /100 | #229 | Tragic 7.0% |
| Creek | 1.6 /100 | #230 | Tragic 7.0% |
| Spanish Americans | 1.6 /100 | #231 | Tragic 7.0% |
| Comanche | 1.5 /100 | #232 | Tragic 7.0% |
| Choctaw | 1.4 /100 | #233 | Tragic 7.0% |
| Chickasaw | 1.4 /100 | #234 | Tragic 7.0% |
| Immigrants | Burma/Myanmar | 1.4 /100 | #235 | Tragic 7.0% |
| Ute | 1.0 /100 | #236 | Tragic 7.1% |
| Arapaho | 1.0 /100 | #237 | Tragic 7.1% |
| Panamanians | 0.9 /100 | #238 | Tragic 7.1% |
| Kiowa | 0.8 /100 | #239 | Tragic 7.1% |