Australian vs Immigrants from Bahamas Disability
COMPARE
Australian
Immigrants from Bahamas
Disability
Disability Comparison
Australians
Immigrants from Bahamas
11.5%
DISABILITY
82.5/ 100
METRIC RATING
144th/ 347
METRIC RANK
12.1%
DISABILITY
4.7/ 100
METRIC RATING
220th/ 347
METRIC RANK
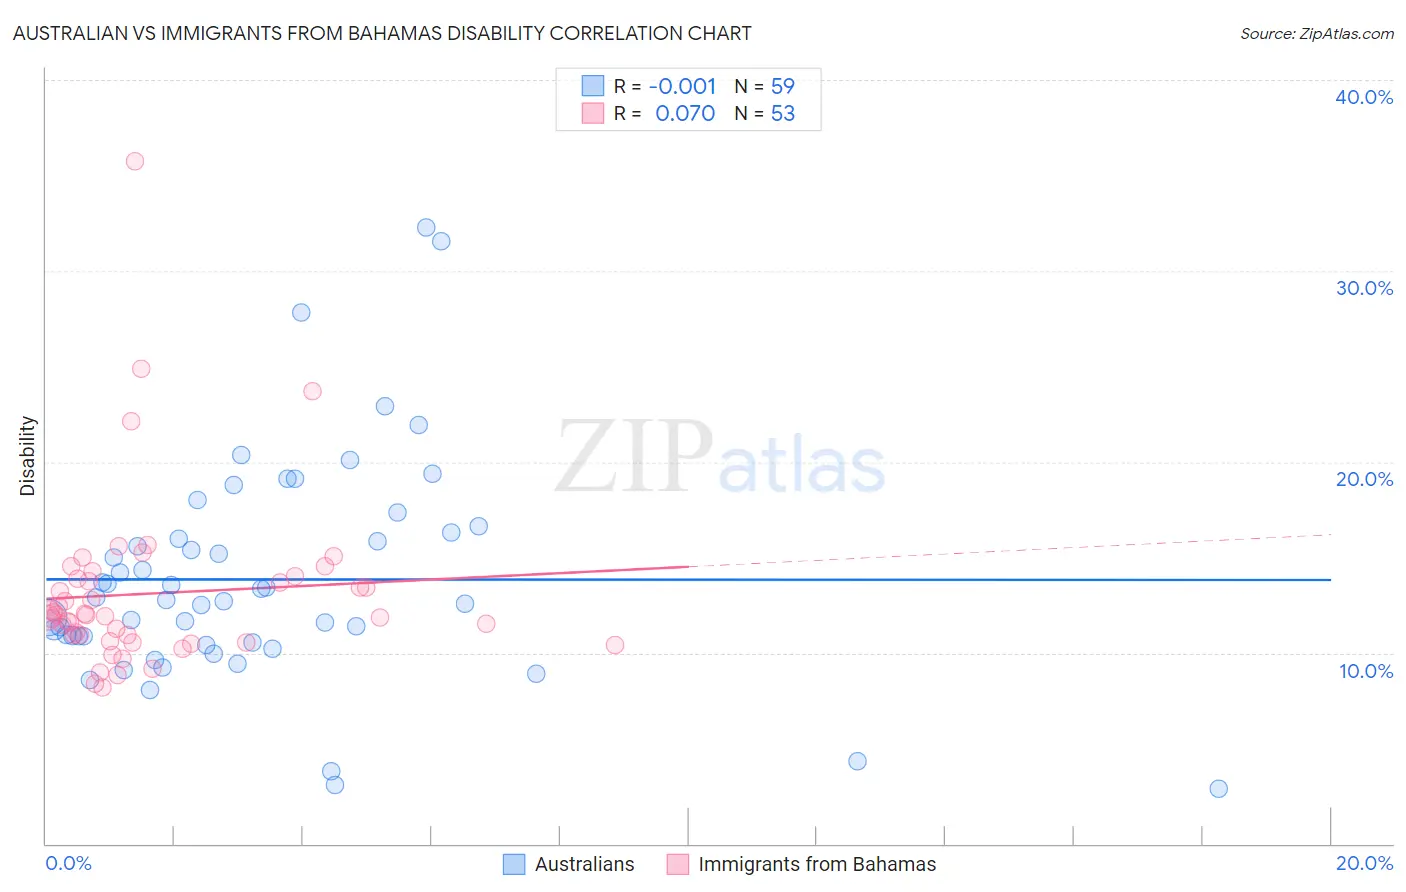
Australian vs Immigrants from Bahamas Disability Correlation Chart
The statistical analysis conducted on geographies consisting of 224,142,596 people shows no correlation between the proportion of Australians and percentage of population with a disability in the United States with a correlation coefficient (R) of -0.001 and weighted average of 11.5%. Similarly, the statistical analysis conducted on geographies consisting of 104,655,290 people shows a slight positive correlation between the proportion of Immigrants from Bahamas and percentage of population with a disability in the United States with a correlation coefficient (R) of 0.070 and weighted average of 12.1%, a difference of 5.1%.
Disability Correlation Summary
| Measurement | Australian | Immigrants from Bahamas |
| Minimum | 2.9% | 8.2% |
| Maximum | 32.3% | 35.8% |
| Range | 29.3% | 27.6% |
| Mean | 13.8% | 13.1% |
| Median | 12.8% | 12.0% |
| Interquartile 25% (IQ1) | 10.6% | 10.8% |
| Interquartile 75% (IQ3) | 16.3% | 14.0% |
| Interquartile Range (IQR) | 5.7% | 3.2% |
| Standard Deviation (Sample) | 5.8% | 4.6% |
| Standard Deviation (Population) | 5.8% | 4.5% |
Similar Demographics by Disability
Demographics Similar to Australians by Disability
In terms of disability, the demographic groups most similar to Australians are Moroccan (11.5%, a difference of 0.070%), Nigerian (11.5%, a difference of 0.090%), Immigrants from Sudan (11.5%, a difference of 0.24%), Immigrants from Hungary (11.5%, a difference of 0.25%), and Immigrants from Grenada (11.5%, a difference of 0.31%).
| Demographics | Rating | Rank | Disability |
| Kenyans | 87.1 /100 | #137 | Excellent 11.5% |
| New Zealanders | 87.0 /100 | #138 | Excellent 11.5% |
| Ghanaians | 87.0 /100 | #139 | Excellent 11.5% |
| Russians | 86.8 /100 | #140 | Excellent 11.5% |
| Immigrants | Grenada | 86.1 /100 | #141 | Excellent 11.5% |
| Immigrants | Sudan | 85.3 /100 | #142 | Excellent 11.5% |
| Moroccans | 83.3 /100 | #143 | Excellent 11.5% |
| Australians | 82.5 /100 | #144 | Excellent 11.5% |
| Nigerians | 81.3 /100 | #145 | Excellent 11.5% |
| Immigrants | Hungary | 79.0 /100 | #146 | Good 11.5% |
| Immigrants | Ukraine | 77.6 /100 | #147 | Good 11.5% |
| Sudanese | 77.1 /100 | #148 | Good 11.5% |
| Immigrants | Norway | 73.2 /100 | #149 | Good 11.6% |
| Romanians | 72.7 /100 | #150 | Good 11.6% |
| Immigrants | Kenya | 72.1 /100 | #151 | Good 11.6% |
Demographics Similar to Immigrants from Bahamas by Disability
In terms of disability, the demographic groups most similar to Immigrants from Bahamas are Croatian (12.1%, a difference of 0.040%), Immigrants from Jamaica (12.1%, a difference of 0.080%), Northern European (12.1%, a difference of 0.12%), Immigrants from North America (12.1%, a difference of 0.15%), and Panamanian (12.1%, a difference of 0.16%).
| Demographics | Rating | Rank | Disability |
| Immigrants | Iraq | 7.1 /100 | #213 | Tragic 12.0% |
| Immigrants | Somalia | 6.8 /100 | #214 | Tragic 12.0% |
| Immigrants | Canada | 6.1 /100 | #215 | Tragic 12.1% |
| Panamanians | 5.4 /100 | #216 | Tragic 12.1% |
| Immigrants | North America | 5.3 /100 | #217 | Tragic 12.1% |
| Immigrants | Jamaica | 5.0 /100 | #218 | Tragic 12.1% |
| Croatians | 4.9 /100 | #219 | Tragic 12.1% |
| Immigrants | Bahamas | 4.7 /100 | #220 | Tragic 12.1% |
| Northern Europeans | 4.2 /100 | #221 | Tragic 12.1% |
| Spanish American Indians | 4.1 /100 | #222 | Tragic 12.1% |
| Hispanics or Latinos | 3.9 /100 | #223 | Tragic 12.1% |
| Mexicans | 3.7 /100 | #224 | Tragic 12.1% |
| Senegalese | 3.5 /100 | #225 | Tragic 12.1% |
| Jamaicans | 3.3 /100 | #226 | Tragic 12.1% |
| Alsatians | 3.3 /100 | #227 | Tragic 12.1% |