Australian vs Immigrants from Austria Disability
COMPARE
Australian
Immigrants from Austria
Disability
Disability Comparison
Australians
Immigrants from Austria
11.5%
DISABILITY
82.5/ 100
METRIC RATING
144th/ 347
METRIC RANK
11.7%
DISABILITY
53.4/ 100
METRIC RATING
169th/ 347
METRIC RANK
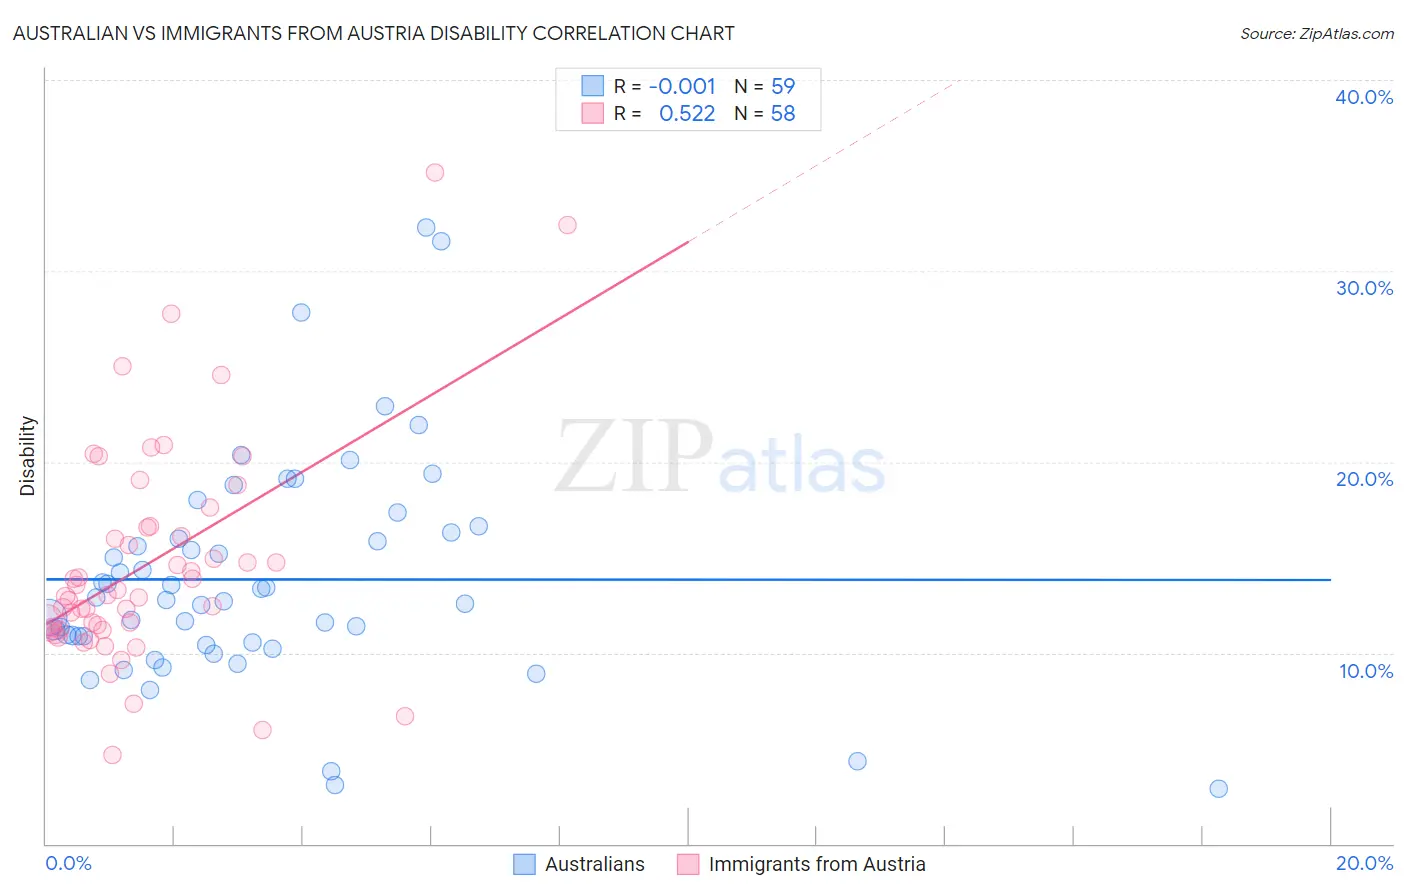
Australian vs Immigrants from Austria Disability Correlation Chart
The statistical analysis conducted on geographies consisting of 224,142,596 people shows no correlation between the proportion of Australians and percentage of population with a disability in the United States with a correlation coefficient (R) of -0.001 and weighted average of 11.5%. Similarly, the statistical analysis conducted on geographies consisting of 167,973,413 people shows a substantial positive correlation between the proportion of Immigrants from Austria and percentage of population with a disability in the United States with a correlation coefficient (R) of 0.522 and weighted average of 11.7%, a difference of 1.6%.
Disability Correlation Summary
| Measurement | Australian | Immigrants from Austria |
| Minimum | 2.9% | 4.6% |
| Maximum | 32.3% | 35.2% |
| Range | 29.3% | 30.5% |
| Mean | 13.8% | 14.6% |
| Median | 12.8% | 13.0% |
| Interquartile 25% (IQ1) | 10.6% | 11.2% |
| Interquartile 75% (IQ3) | 16.3% | 16.5% |
| Interquartile Range (IQR) | 5.7% | 5.3% |
| Standard Deviation (Sample) | 5.8% | 5.8% |
| Standard Deviation (Population) | 5.8% | 5.8% |
Similar Demographics by Disability
Demographics Similar to Australians by Disability
In terms of disability, the demographic groups most similar to Australians are Moroccan (11.5%, a difference of 0.070%), Nigerian (11.5%, a difference of 0.090%), Immigrants from Sudan (11.5%, a difference of 0.24%), Immigrants from Hungary (11.5%, a difference of 0.25%), and Immigrants from Grenada (11.5%, a difference of 0.31%).
| Demographics | Rating | Rank | Disability |
| Kenyans | 87.1 /100 | #137 | Excellent 11.5% |
| New Zealanders | 87.0 /100 | #138 | Excellent 11.5% |
| Ghanaians | 87.0 /100 | #139 | Excellent 11.5% |
| Russians | 86.8 /100 | #140 | Excellent 11.5% |
| Immigrants | Grenada | 86.1 /100 | #141 | Excellent 11.5% |
| Immigrants | Sudan | 85.3 /100 | #142 | Excellent 11.5% |
| Moroccans | 83.3 /100 | #143 | Excellent 11.5% |
| Australians | 82.5 /100 | #144 | Excellent 11.5% |
| Nigerians | 81.3 /100 | #145 | Excellent 11.5% |
| Immigrants | Hungary | 79.0 /100 | #146 | Good 11.5% |
| Immigrants | Ukraine | 77.6 /100 | #147 | Good 11.5% |
| Sudanese | 77.1 /100 | #148 | Good 11.5% |
| Immigrants | Norway | 73.2 /100 | #149 | Good 11.6% |
| Romanians | 72.7 /100 | #150 | Good 11.6% |
| Immigrants | Kenya | 72.1 /100 | #151 | Good 11.6% |
Demographics Similar to Immigrants from Austria by Disability
In terms of disability, the demographic groups most similar to Immigrants from Austria are Immigrants from Latin America (11.7%, a difference of 0.030%), Immigrants from Albania (11.7%, a difference of 0.030%), Immigrants from Southern Europe (11.7%, a difference of 0.030%), Trinidadian and Tobagonian (11.7%, a difference of 0.030%), and Estonian (11.7%, a difference of 0.050%).
| Demographics | Rating | Rank | Disability |
| Immigrants | Haiti | 59.2 /100 | #162 | Average 11.7% |
| Immigrants | Trinidad and Tobago | 58.9 /100 | #163 | Average 11.7% |
| Syrians | 58.5 /100 | #164 | Average 11.7% |
| Cubans | 56.7 /100 | #165 | Average 11.7% |
| Pakistanis | 54.7 /100 | #166 | Average 11.7% |
| Estonians | 54.4 /100 | #167 | Average 11.7% |
| Immigrants | Latin America | 54.1 /100 | #168 | Average 11.7% |
| Immigrants | Austria | 53.4 /100 | #169 | Average 11.7% |
| Immigrants | Albania | 52.8 /100 | #170 | Average 11.7% |
| Immigrants | Southern Europe | 52.8 /100 | #171 | Average 11.7% |
| Trinidadians and Tobagonians | 52.7 /100 | #172 | Average 11.7% |
| Maltese | 50.6 /100 | #173 | Average 11.7% |
| Albanians | 50.0 /100 | #174 | Average 11.7% |
| Haitians | 48.6 /100 | #175 | Average 11.7% |
| Immigrants | Western Africa | 47.5 /100 | #176 | Average 11.7% |