Australian vs Syrian Disability
COMPARE
Australian
Syrian
Disability
Disability Comparison
Australians
Syrians
11.5%
DISABILITY
82.5/ 100
METRIC RATING
144th/ 347
METRIC RANK
11.7%
DISABILITY
58.5/ 100
METRIC RATING
164th/ 347
METRIC RANK
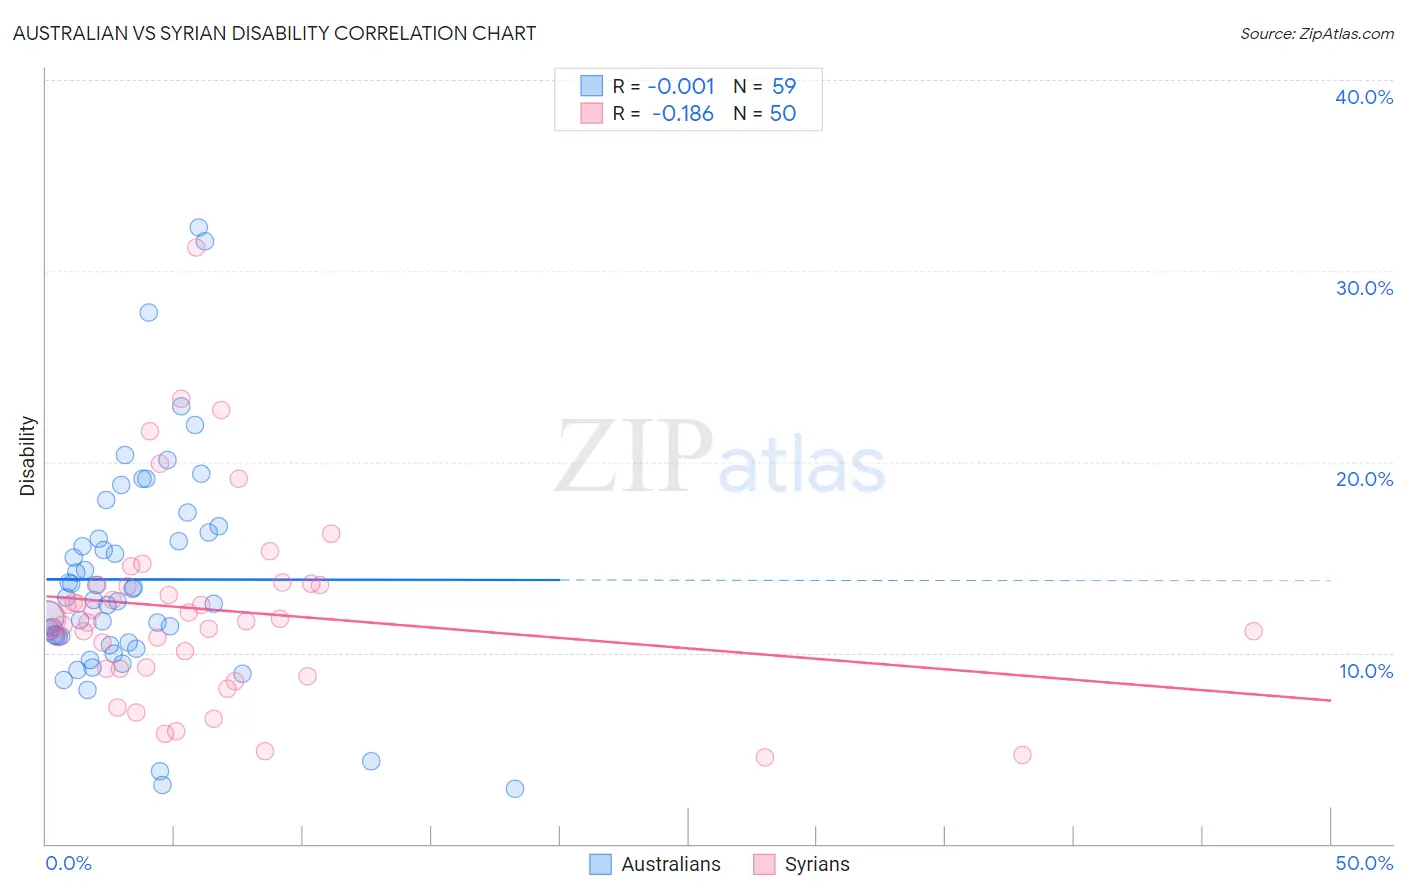
Australian vs Syrian Disability Correlation Chart
The statistical analysis conducted on geographies consisting of 224,142,596 people shows no correlation between the proportion of Australians and percentage of population with a disability in the United States with a correlation coefficient (R) of -0.001 and weighted average of 11.5%. Similarly, the statistical analysis conducted on geographies consisting of 266,315,243 people shows a poor negative correlation between the proportion of Syrians and percentage of population with a disability in the United States with a correlation coefficient (R) of -0.186 and weighted average of 11.7%, a difference of 1.4%.
Disability Correlation Summary
| Measurement | Australian | Syrian |
| Minimum | 2.9% | 4.5% |
| Maximum | 32.3% | 31.2% |
| Range | 29.3% | 26.7% |
| Mean | 13.8% | 12.2% |
| Median | 12.8% | 11.7% |
| Interquartile 25% (IQ1) | 10.6% | 9.2% |
| Interquartile 75% (IQ3) | 16.3% | 13.6% |
| Interquartile Range (IQR) | 5.7% | 4.4% |
| Standard Deviation (Sample) | 5.8% | 5.1% |
| Standard Deviation (Population) | 5.8% | 5.0% |
Demographics Similar to Australians and Syrians by Disability
In terms of disability, the demographic groups most similar to Australians are Nigerian (11.5%, a difference of 0.090%), Immigrants from Hungary (11.5%, a difference of 0.25%), Immigrants from Ukraine (11.5%, a difference of 0.34%), Sudanese (11.5%, a difference of 0.38%), and Immigrants from Norway (11.6%, a difference of 0.62%). Similarly, the demographic groups most similar to Syrians are Immigrants from Trinidad and Tobago (11.7%, a difference of 0.020%), Immigrants from Haiti (11.7%, a difference of 0.030%), Immigrants from Cuba (11.6%, a difference of 0.20%), Immigrants from Barbados (11.6%, a difference of 0.27%), and Guatemalan (11.6%, a difference of 0.31%).
| Demographics | Rating | Rank | Disability |
| Australians | 82.5 /100 | #144 | Excellent 11.5% |
| Nigerians | 81.3 /100 | #145 | Excellent 11.5% |
| Immigrants | Hungary | 79.0 /100 | #146 | Good 11.5% |
| Immigrants | Ukraine | 77.6 /100 | #147 | Good 11.5% |
| Sudanese | 77.1 /100 | #148 | Good 11.5% |
| Immigrants | Norway | 73.2 /100 | #149 | Good 11.6% |
| Romanians | 72.7 /100 | #150 | Good 11.6% |
| Immigrants | Kenya | 72.1 /100 | #151 | Good 11.6% |
| Immigrants | Moldova | 72.0 /100 | #152 | Good 11.6% |
| Immigrants | Ghana | 71.2 /100 | #153 | Good 11.6% |
| Immigrants | Guatemala | 71.1 /100 | #154 | Good 11.6% |
| Immigrants | Netherlands | 69.8 /100 | #155 | Good 11.6% |
| Immigrants | Fiji | 69.5 /100 | #156 | Good 11.6% |
| Immigrants | Middle Africa | 69.5 /100 | #157 | Good 11.6% |
| Armenians | 65.9 /100 | #158 | Good 11.6% |
| Guatemalans | 65.1 /100 | #159 | Good 11.6% |
| Immigrants | Barbados | 64.2 /100 | #160 | Good 11.6% |
| Immigrants | Cuba | 62.8 /100 | #161 | Good 11.6% |
| Immigrants | Haiti | 59.2 /100 | #162 | Average 11.7% |
| Immigrants | Trinidad and Tobago | 58.9 /100 | #163 | Average 11.7% |
| Syrians | 58.5 /100 | #164 | Average 11.7% |