Immigrants from Belarus vs Bermudan Male Disability
COMPARE
Immigrants from Belarus
Bermudan
Male Disability
Male Disability Comparison
Immigrants from Belarus
Bermudans
10.4%
MALE DISABILITY
99.3/ 100
METRIC RATING
63rd/ 347
METRIC RANK
11.8%
MALE DISABILITY
2.3/ 100
METRIC RATING
229th/ 347
METRIC RANK
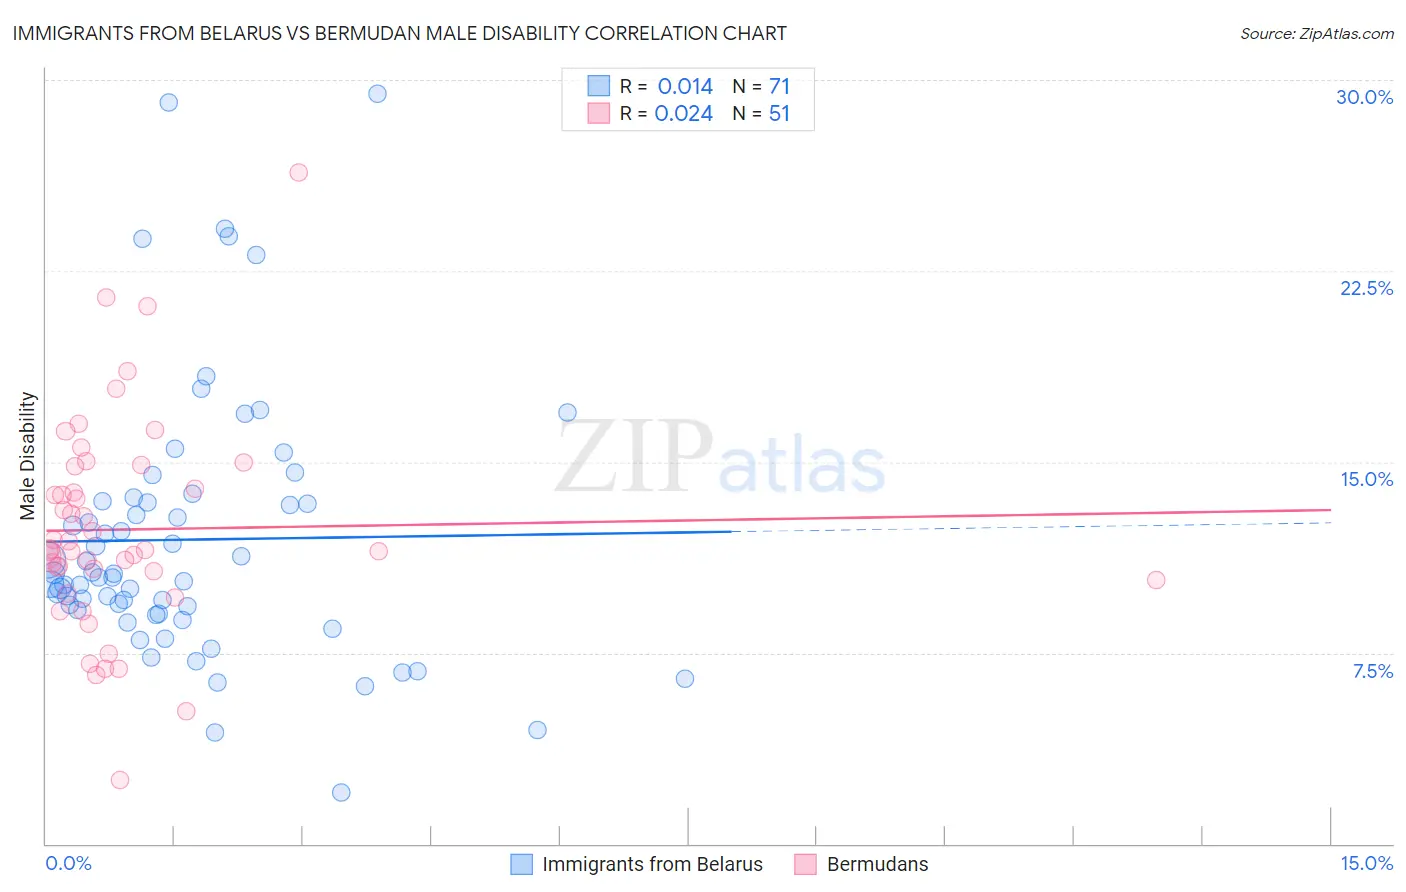
Immigrants from Belarus vs Bermudan Male Disability Correlation Chart
The statistical analysis conducted on geographies consisting of 150,193,333 people shows no correlation between the proportion of Immigrants from Belarus and percentage of males with a disability in the United States with a correlation coefficient (R) of 0.014 and weighted average of 10.4%. Similarly, the statistical analysis conducted on geographies consisting of 55,719,731 people shows no correlation between the proportion of Bermudans and percentage of males with a disability in the United States with a correlation coefficient (R) of 0.024 and weighted average of 11.8%, a difference of 13.0%.
Male Disability Correlation Summary
| Measurement | Immigrants from Belarus | Bermudan |
| Minimum | 2.0% | 2.5% |
| Maximum | 29.5% | 26.4% |
| Range | 27.4% | 23.9% |
| Mean | 11.9% | 12.3% |
| Median | 10.5% | 11.5% |
| Interquartile 25% (IQ1) | 9.0% | 10.3% |
| Interquartile 75% (IQ3) | 13.5% | 14.8% |
| Interquartile Range (IQR) | 4.4% | 4.5% |
| Standard Deviation (Sample) | 5.3% | 4.2% |
| Standard Deviation (Population) | 5.2% | 4.2% |
Similar Demographics by Male Disability
Demographics Similar to Immigrants from Belarus by Male Disability
In terms of male disability, the demographic groups most similar to Immigrants from Belarus are Immigrants from Ecuador (10.4%, a difference of 0.020%), Jordanian (10.5%, a difference of 0.12%), Immigrants from Grenada (10.5%, a difference of 0.15%), Guyanese (10.5%, a difference of 0.15%), and Immigrants from Afghanistan (10.5%, a difference of 0.16%).
| Demographics | Rating | Rank | Male Disability |
| Tongans | 99.6 /100 | #56 | Exceptional 10.4% |
| Immigrants | South America | 99.6 /100 | #57 | Exceptional 10.4% |
| Immigrants | Japan | 99.5 /100 | #58 | Exceptional 10.4% |
| Immigrants | Australia | 99.5 /100 | #59 | Exceptional 10.4% |
| Immigrants | Colombia | 99.5 /100 | #60 | Exceptional 10.4% |
| Immigrants | Northern Africa | 99.4 /100 | #61 | Exceptional 10.4% |
| Immigrants | Ecuador | 99.3 /100 | #62 | Exceptional 10.4% |
| Immigrants | Belarus | 99.3 /100 | #63 | Exceptional 10.4% |
| Jordanians | 99.3 /100 | #64 | Exceptional 10.5% |
| Immigrants | Grenada | 99.2 /100 | #65 | Exceptional 10.5% |
| Guyanese | 99.2 /100 | #66 | Exceptional 10.5% |
| Immigrants | Afghanistan | 99.2 /100 | #67 | Exceptional 10.5% |
| Colombians | 99.2 /100 | #68 | Exceptional 10.5% |
| Ecuadorians | 99.2 /100 | #69 | Exceptional 10.5% |
| Immigrants | Bulgaria | 99.1 /100 | #70 | Exceptional 10.5% |
Demographics Similar to Bermudans by Male Disability
In terms of male disability, the demographic groups most similar to Bermudans are Hispanic or Latino (11.8%, a difference of 0.030%), Croatian (11.8%, a difference of 0.090%), Austrian (11.8%, a difference of 0.11%), Dominican (11.8%, a difference of 0.28%), and Subsaharan African (11.8%, a difference of 0.29%).
| Demographics | Rating | Rank | Male Disability |
| Alsatians | 3.3 /100 | #222 | Tragic 11.7% |
| Immigrants | Bahamas | 3.2 /100 | #223 | Tragic 11.7% |
| Japanese | 3.1 /100 | #224 | Tragic 11.7% |
| Liberians | 3.1 /100 | #225 | Tragic 11.8% |
| Sub-Saharan Africans | 2.8 /100 | #226 | Tragic 11.8% |
| Austrians | 2.5 /100 | #227 | Tragic 11.8% |
| Hispanics or Latinos | 2.3 /100 | #228 | Tragic 11.8% |
| Bermudans | 2.3 /100 | #229 | Tragic 11.8% |
| Croatians | 2.1 /100 | #230 | Tragic 11.8% |
| Dominicans | 1.8 /100 | #231 | Tragic 11.8% |
| Malaysians | 1.8 /100 | #232 | Tragic 11.8% |
| Mexicans | 1.7 /100 | #233 | Tragic 11.8% |
| Immigrants | Canada | 1.6 /100 | #234 | Tragic 11.9% |
| Immigrants | North America | 1.5 /100 | #235 | Tragic 11.9% |
| U.S. Virgin Islanders | 1.3 /100 | #236 | Tragic 11.9% |