Slavic vs Bermudan Male Disability
COMPARE
Slavic
Bermudan
Male Disability
Male Disability Comparison
Slavs
Bermudans
12.2%
MALE DISABILITY
0.2/ 100
METRIC RATING
261st/ 347
METRIC RANK
11.8%
MALE DISABILITY
2.3/ 100
METRIC RATING
229th/ 347
METRIC RANK
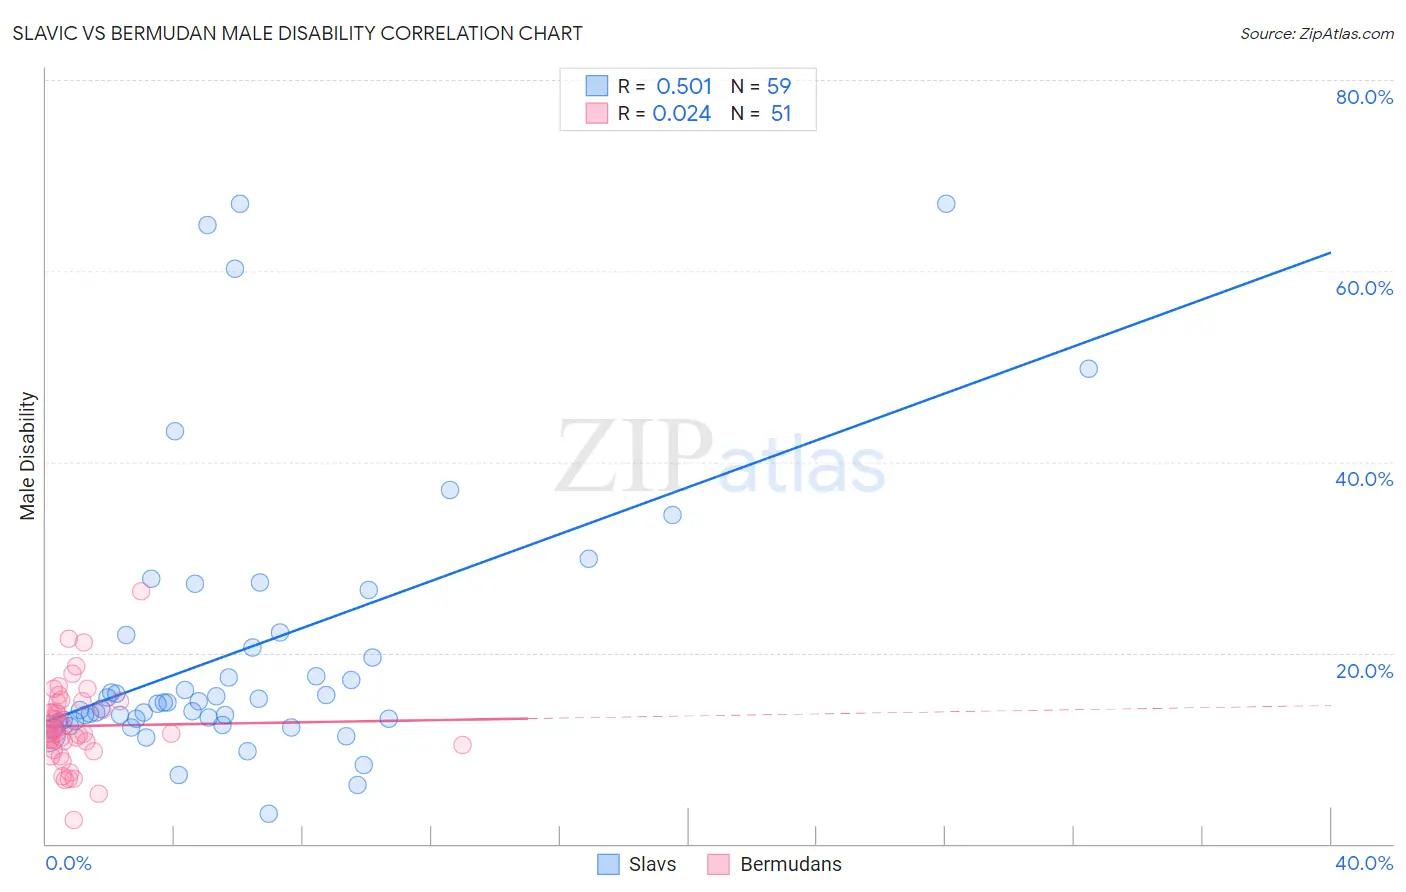
Slavic vs Bermudan Male Disability Correlation Chart
The statistical analysis conducted on geographies consisting of 270,856,634 people shows a substantial positive correlation between the proportion of Slavs and percentage of males with a disability in the United States with a correlation coefficient (R) of 0.501 and weighted average of 12.2%. Similarly, the statistical analysis conducted on geographies consisting of 55,719,731 people shows no correlation between the proportion of Bermudans and percentage of males with a disability in the United States with a correlation coefficient (R) of 0.024 and weighted average of 11.8%, a difference of 3.2%.
Male Disability Correlation Summary
| Measurement | Slavic | Bermudan |
| Minimum | 3.2% | 2.5% |
| Maximum | 67.0% | 26.4% |
| Range | 63.9% | 23.9% |
| Mean | 20.3% | 12.3% |
| Median | 14.8% | 11.5% |
| Interquartile 25% (IQ1) | 12.8% | 10.3% |
| Interquartile 75% (IQ3) | 21.9% | 14.8% |
| Interquartile Range (IQR) | 9.1% | 4.5% |
| Standard Deviation (Sample) | 14.7% | 4.2% |
| Standard Deviation (Population) | 14.6% | 4.2% |
Similar Demographics by Male Disability
Demographics Similar to Slavs by Male Disability
In terms of male disability, the demographic groups most similar to Slavs are Norwegian (12.2%, a difference of 0.010%), Canadian (12.2%, a difference of 0.21%), Nepalese (12.2%, a difference of 0.25%), Swedish (12.1%, a difference of 0.36%), and Belgian (12.1%, a difference of 0.43%).
| Demographics | Rating | Rank | Male Disability |
| British | 0.4 /100 | #254 | Tragic 12.1% |
| Chinese | 0.4 /100 | #255 | Tragic 12.1% |
| Swiss | 0.3 /100 | #256 | Tragic 12.1% |
| Europeans | 0.3 /100 | #257 | Tragic 12.1% |
| Basques | 0.3 /100 | #258 | Tragic 12.1% |
| Belgians | 0.3 /100 | #259 | Tragic 12.1% |
| Swedes | 0.3 /100 | #260 | Tragic 12.1% |
| Slavs | 0.2 /100 | #261 | Tragic 12.2% |
| Norwegians | 0.2 /100 | #262 | Tragic 12.2% |
| Canadians | 0.2 /100 | #263 | Tragic 12.2% |
| Nepalese | 0.2 /100 | #264 | Tragic 12.2% |
| Immigrants | Portugal | 0.1 /100 | #265 | Tragic 12.3% |
| Hawaiians | 0.1 /100 | #266 | Tragic 12.3% |
| Immigrants | Germany | 0.1 /100 | #267 | Tragic 12.3% |
| Portuguese | 0.1 /100 | #268 | Tragic 12.3% |
Demographics Similar to Bermudans by Male Disability
In terms of male disability, the demographic groups most similar to Bermudans are Hispanic or Latino (11.8%, a difference of 0.030%), Croatian (11.8%, a difference of 0.090%), Austrian (11.8%, a difference of 0.11%), Dominican (11.8%, a difference of 0.28%), and Subsaharan African (11.8%, a difference of 0.29%).
| Demographics | Rating | Rank | Male Disability |
| Alsatians | 3.3 /100 | #222 | Tragic 11.7% |
| Immigrants | Bahamas | 3.2 /100 | #223 | Tragic 11.7% |
| Japanese | 3.1 /100 | #224 | Tragic 11.7% |
| Liberians | 3.1 /100 | #225 | Tragic 11.8% |
| Sub-Saharan Africans | 2.8 /100 | #226 | Tragic 11.8% |
| Austrians | 2.5 /100 | #227 | Tragic 11.8% |
| Hispanics or Latinos | 2.3 /100 | #228 | Tragic 11.8% |
| Bermudans | 2.3 /100 | #229 | Tragic 11.8% |
| Croatians | 2.1 /100 | #230 | Tragic 11.8% |
| Dominicans | 1.8 /100 | #231 | Tragic 11.8% |
| Malaysians | 1.8 /100 | #232 | Tragic 11.8% |
| Mexicans | 1.7 /100 | #233 | Tragic 11.8% |
| Immigrants | Canada | 1.6 /100 | #234 | Tragic 11.9% |
| Immigrants | North America | 1.5 /100 | #235 | Tragic 11.9% |
| U.S. Virgin Islanders | 1.3 /100 | #236 | Tragic 11.9% |